Posts

Showing posts from 2014

RFS2 Set to Ramp up Biodiesel Usage

U.S. EPA has stalled the release of the annual usage mandates for bio fuels in the United States. These are due out each November, but neither the 2014 or 2015 figures have been released. EPA says it will put forth new numbers next spring. In the meantime, it might be important to consider just how using the default numbers would play out for the production of ethanol and biodiesel.


The United States congress set renewable fuels mandates a few years ago. It also gave U.S. EPA the power to adjust those mandates. EPA hasn’t done so for the 2014 calendar year, or for 2015. We’ll dispose of the political baggage and simply focus on the results of using the default statutes written into the law.

Ethanol Production Profits Dim as Gasoline Prices Plummet

by Scott Irwin & Darrel Good

The magnitude of the decline in crude oil and gasoline prices has taken nearly everyone by surprise. NYMEX nearby crude oil futures this week touched $60 per barrel, almost $50 less than peak prices last summer. This is a major economic event with potentially far-reaching impacts for biofuels markets. We examined some of these impacts in two recent farmdoc daily articles (November 12, 2014; December 4, 2014). Our conclusion was that current high ethanol prices relative to gasoline prices, as illustrated in Figure 1, might slow the growth in domestic ethanol consumption, but would not likely result in consumption that is less than the 10 percent blend wall. In contrast, the high price ratio may represent a threat to

The Pace of Corn Consumption


Darrel Good, Ag Economist – University of Illinois

Now that the nation’s corn harvest is complete, traders have turned their full attention to the rate at which the crop is being used. Todd Gleason has more on the pace of corn consumption.

There are three primary uses for corn…

Crude Oil Crash - Start Pricing Needs

Each Tuesday during the Closing Market Report we talk with an energy analyst. This week Growmark's Harry Cooney turned his attention to OPEC, the dramatic drop in the price of a barrel of crude oil, and what to do about pricing 2015 fuel needs. You may listen to the conversation here.

WILLAg Farm Assets Outlook Panel Discussions

Old Iron Plowing Fever

Farm Assets Conference Tickets Available Now


FARM ASSETS CONFERENCE
10:15am - 5:00pm November 24, 2014

Marriott Hotel & Conference Center
201 Broadway St, Normal, IL 61761

This is a new signature event for WILLAg.

The WILLAg Farm Assets Conference sponsored in part by the Farm Credit System hopes to provide farmers and landowners decision​making tools for their business assets. The $25 registration fee includes the noon meal. Those attending can expect to hear pricing information on agricultural commodities from WILLAg’s regular ON AIR experts, learn how the new farm bill might impact crop insurance decisions going forward, to effectively analyze and choose between the new federal ARC and PLC programs, and explore the value of farm land.

Corn & Soybean Commodity Distribution


A G R I C U L T U R E
University  of  Illinois

Todd E. Gleason, Farm Broadcaster
1301 W Gregory Dr, Rm75  MC710
College of Agricultural, Consumer & Environmental Sciences
Urbana, Illinois  61801

tgleason@illinois.edu
work (217) 333-9697


POPULATION NOTES

* 0001 - 200 million people on the planet

* 1800 - 1 billion people on the planet
   - 300 man hours to produce 100 bushels wheat from

Ag Census Mapping Tool Makes Data Visual

Every five years the United States Department of Agriculture takes a census. USDA NASS collects all kinds of data about farm production in the U.S.A. The agency has developed a tool to map this data. It is a way to visualize agricultural production, income, wealth distribution, management type, and the demographics of farmers. These three maps show the primary growing regions for corn, soybean, and wheat. The darkest green areas represent acres where the cropland is at least 45 percent sown to the crop listed. The corn belt is easy to see, and not that much of a surprise. However, the primary soybean growing regions of the nation are bit more diverse than you might expect and seem to follow the Mississippi Valley watershed from New Orleans to St. Louis, along the Ohio River Valley and the mighty Missouri River.

How Many Corn Acres in 2015


If corn farmers want a break even price for their crop next year, they’ll need to plant fewer acres of it. Todd Gleason has more on how one ag economist has forward figured the number of corn acres needed in 2015 to push cash prices back above four dollars a bushels.

Store Corn for Higher Prices Later

The price of corn isn’t great if you are a farmer trying to sell it at a profit. However, the good news may be that prices later in this year and next are likely to get better.

Tuscola, Illinois - Small Town Big Impact


Today Tuscola, Illinois will announce it will be home to a new granular urea plant. It will be built by Cronus and employee nearly 200 on completion. The plant will provide farmers within a 150 mile radius a local source for nitrogen fertilizer.

The video included here was produced by the City of Tuscola to highlight its agricultural industrial complex.

USDA Finalizes Farm Program Rules

by Jonathan Coppess, Gary Schnitkey, Nick Paulson, and Carl Zulauf
University of Illinois College of ACES and The Ohio State University

Thursday, September 25, 2014, U.S. Secretary of Agriculture Tom Vilsack announced the regulations for the Agriculture Risk Coverage (ARC) and Price Loss Coverage (PLC) programs created by the 2014 Farm Bill. Along with the regulation, Secretary Vilsack also announced the public release of the web-based decision tools that have been developed under cooperative agreements with the Farm Service Agency. This article provides more information on these items.
Background
The Agriculture Act of 2014 (the 2014 Farm Bill) revised the commodity support programs beginning with the 2014 crop year. Direct payments, counter-cyclical payments and the Average Crop Revenue Election payments were eliminated by this farm bill. In place of those support programs, three new programs were created for covered commodities or program crops. These programs are: Agriculture Risk Coverage, County Option (ARC-CO), Agriculture Risk Coverage, Individual Farm Coverage (ARC-IC), and Price Loss Coverage (PLC). The 2014 Farm Bill also provided one-time opportunities for farm owners to update the payment yields for the FSA farm and a one-time opportunity to reallocate the base acres among program crops planted on the FSA farm. Finally, the farm bill included funds for the development of web-based decision aids or tools that farmers, landowners and others could use to help sort through the program decisions required.

Discussion
The University of Illinois as the lead institution for a national coalition has worked under a cooperative agreement to develop the web-based decision tools. In addition to the web-based tools, the coalition has also created an online resource site affiliated with farmdoc and will be conducting outreach, education and training on the programs and the web-based tools. The following is an overview of the resources currently available.
(1) The Farm Bill Toolbox on farmdoc: a one-stop resource for all aspects of the farm bill program decisions, it is available here (or by entering the following web address: http://farmbilltoolbox.farmdoc.illinois.edu) provides a seven-step decision process or matrix to guide producers through the program decisions and use of the web-based tool. The Toolbox also provides one-page fact sheets and links to additional resources such as previously published articles and new articles on farm bill program issues and topics. Finally, the farmdoc team will be conducting weekly webinars explaining the programs, the web-based tool and analysis, as well as program and harvest updates. These webinars will be every Friday morning at 8:00 a.m. (CST) beginning September 26th and continuing through the end of October. Webinars will be archived and available for review. Additional webinars are also available in the archives. For registration, more information and archives please visit the Farm Bill Toolbox.
(2) The Agriculture Policy Analysis System (APAS): available here (or by entering the following web address: http://fsa.usapas.com) this web-based application provides the ability to calculate updated payment yields for the FSA farm, calculate reallocated base acres for the FSA farm and analyze, compare and understand the program choices (ARC-CO, ARC-IC and PLC/SCO). Program analysis and information is available in two forms. First, the Sample Farms button allows for a quick program comparison and analysis based on a data-generated sample farm for your state and county, both expected program payments and per-acre, crop-by-crop payments. Producers can also select the Build Your Own Farm (BYOF) option that will allow them to input their farm-specific information and run estimates of program payments. Both options also provide a "safety net" analysis using specific revenue targets and providing the probability of reaching those revenue targets under different program scenarios.
(3) Farm Service Agency: the APAS web-based tool is also available on the FSA website, along with detailed fact sheets and other related program information (available here or by entering the following web address: www.fsa.usda.gov/arc-plc).
FSA has not announced a final deadline for making the farm program decisions (payment yields, base acre reallocation and program election), but it is anticipated that the deadline will be sometime in 2015, maybe as late as March. Producers and landowners are encouraged to wait until later in the year or early next year. More information about prices and yields will be known at that time, allowing for a more informed, better decision. With many farmers already in the fields, or about to begin harvesting, there is no immediate action needed. There is time to learn more about the programs, use the web-based tools and understand the analysis before any decision will have to be made. Updates on deadlines and program decisions will be available on the Farm Bill Toolbox and through farmdoc daily.

USDA Updates Cash Rents by County


In recent weeks, two sources released cash rent information for Illinois. The U.S. Department of Agriculture released county average cash rents for 2014. The Illinois Society of Professional Farm Managers and Rural Appraisers released 2014 and expected 2015 cash rents for professionally managed farmland. Expected 2015 rents point to decreasing cash rent levels on professionally managed farmland. Whether or not other cash rents follow professionally managed cash rents down is an open question.

Average Cash Rents in Illinois

The National Agricultural Statistical Service (NASS) - an agency of the U.S. Department of Agriculture - released 2014 average rents per county on September 5, 2014. A number of counties do not have cash rents reported, likely because statistically reliable rents could not be obtained with survey responses.

As can be seen in Figure 1, there is a considerable range in cash rents across Illinois. Four counties had average cash rents over $300 per acre: Logan ($308 per acre), Piatt ($303 per acre), Sangamon ($302 per acre), and Ogle ($300 per acre). Except for Ogle County, these high-rent counties are located in central Illinois. The five counties with the lowest cash rents are Johnson ($80 per acre), Williamson County ($92 per acre), Perry ($106 per acre), Saline ($107 per acre), and Franklin ($108 per acre). These counties with the lowest cash rents are located in southern Illinois. Generally, average cash rent levels are related to productivity, with counties having more productive farmland have higher cash rents than those counties with less productive farmland (farmdoc daily, September 10, 2013).

figure1.jpg

Overall, 2014 average cash rents were higher in 2014 than 2013. According to NASS, the average rent in Illinois increased from $224 per acre in 2013 to $234 per acre in 2014, an increase of 5%. This continued a string of years of large increases. Since 2006, average state rents in Illinois have increased from $132 per acre in 2006 to $234 per acre in 2014, an increase over this eight year period of 77%.

Professional Cash Rents Levels

The Illinois Society of Professional Farm Managers and Rural Appraiser released results of its annual mid-year survey. This survey asked for 2014 and expected 2015 cash rents on professionally managed farmland. These rents, along with 2013 cash rents from a previous survey, are shown in Table 1. Average rent levels are shown for four classes of farmland productivity:

Excellent - expected corn yields are over 190 bushels per acre
Good - expected corn yields are between 170 and 190 bushels per acre,
Average - expected corn yields are between 150 and 170 bushels per acre, and
Fair - expected corn yields are below 150 bushels per acre.
table1.jpg

Average cash rents decreased between 2013 and 2014. For excellent quality farmland, cash rents decreased from $396 per acre to $374 per acre in 2014, a decrease of $14 per acre.

Decreases for professionally managed farmland stands in contrast to average cash rents, which increased from $224 per acre in 2013 to $234 per acre in 2014. Farm managers follow agricultural markets, likely much more closely than land owners without management. As a result, farm managers likely set rents closer to those suggested by market conditions. Cash rents on professionally managed farmland increased faster than average cash rents between 2006 and 2013, when returns rose as a result of higher prices. Now that prices have decreased from levels experienced during 2009 through 2013, farm managers are lowering cash rents. On farmland, not managed there may be considerably more lagged relationship between changes in returns and changes in rent levels.

On professionally managed farmland, cash rents likely will continue to decline into 2015. For all quality classes, Society members indicated that rents would be lower in 2015. For excellent quality farmland, for example, cash rents are projected to decrease from $374 per acre in 2014 to $338 per acre in 2014, a decrease of $36 per acre (see Table 1). If the decrease occurs, cash rents would decrease by about 10%.

There is a considerable range in cash rents for similar productivity farmland within a small geographical area, with some rents above the average by $100 and other rents below the average by $100. Below average cash rents could continue to increase to "catch up" with average levels. At the same time, above average cash rents could decrease, as indicated by results from the Illinois Society. These two forces could counter each other, leading to stable or maybe even increasing average cash rent levels.

Projections are for much lower returns in 2014 and 2015 return (farmdoc daily, July 8, 2014). Even with decreases in cash rents projected by the Illinois Society, farmer returns would be projected to decrease because returns have decreased more than cash rents.

Summary

Rents on professionally managed farmland could decrease in 2015. Other above average cash rents could decrease as well. However, below average cash rents may remain stable or increase. Overall, rent decreases likely will not cover decreases in lower returns projected for 2014 and 2015.

Setting Silage Chop for Best Digestion

Corn silage can make up to as much as thirty to forty percent of a dairy cow’s diet. So, it is really important to get it right. That starts in the field. See more on some University of Illinois work on harvesting silage.

ILLINOIS' Carl Bradley on SDS & White Mold in Soybean

Some farmers like to see a little SDS because it occurs more often in high yield years for soybeans.

…anecdotal


Conserving Soil & Protecting Water - it's kinda what we do...


Farm Program Decision & WILLAg Outlook Panels Scheduled

Book your WILLAg event today for this fall or winter. We'll be glad to work with you to set up a WILLAg Panel of analysts to discuss the commodity markets, arrange for University of Illinois campus based agricultural specialists in economics, crops, or livestock, or simply to come speak to your group or organization. Contact Todd Gleason for complete details.

Todd E. Gleason, Farm Broadcaster
College of ACES / Univesity of Illinois Extension
tgleason@illinois.edu or (217) 333-9697

Click on an event for complete details...


August Corn Estimates

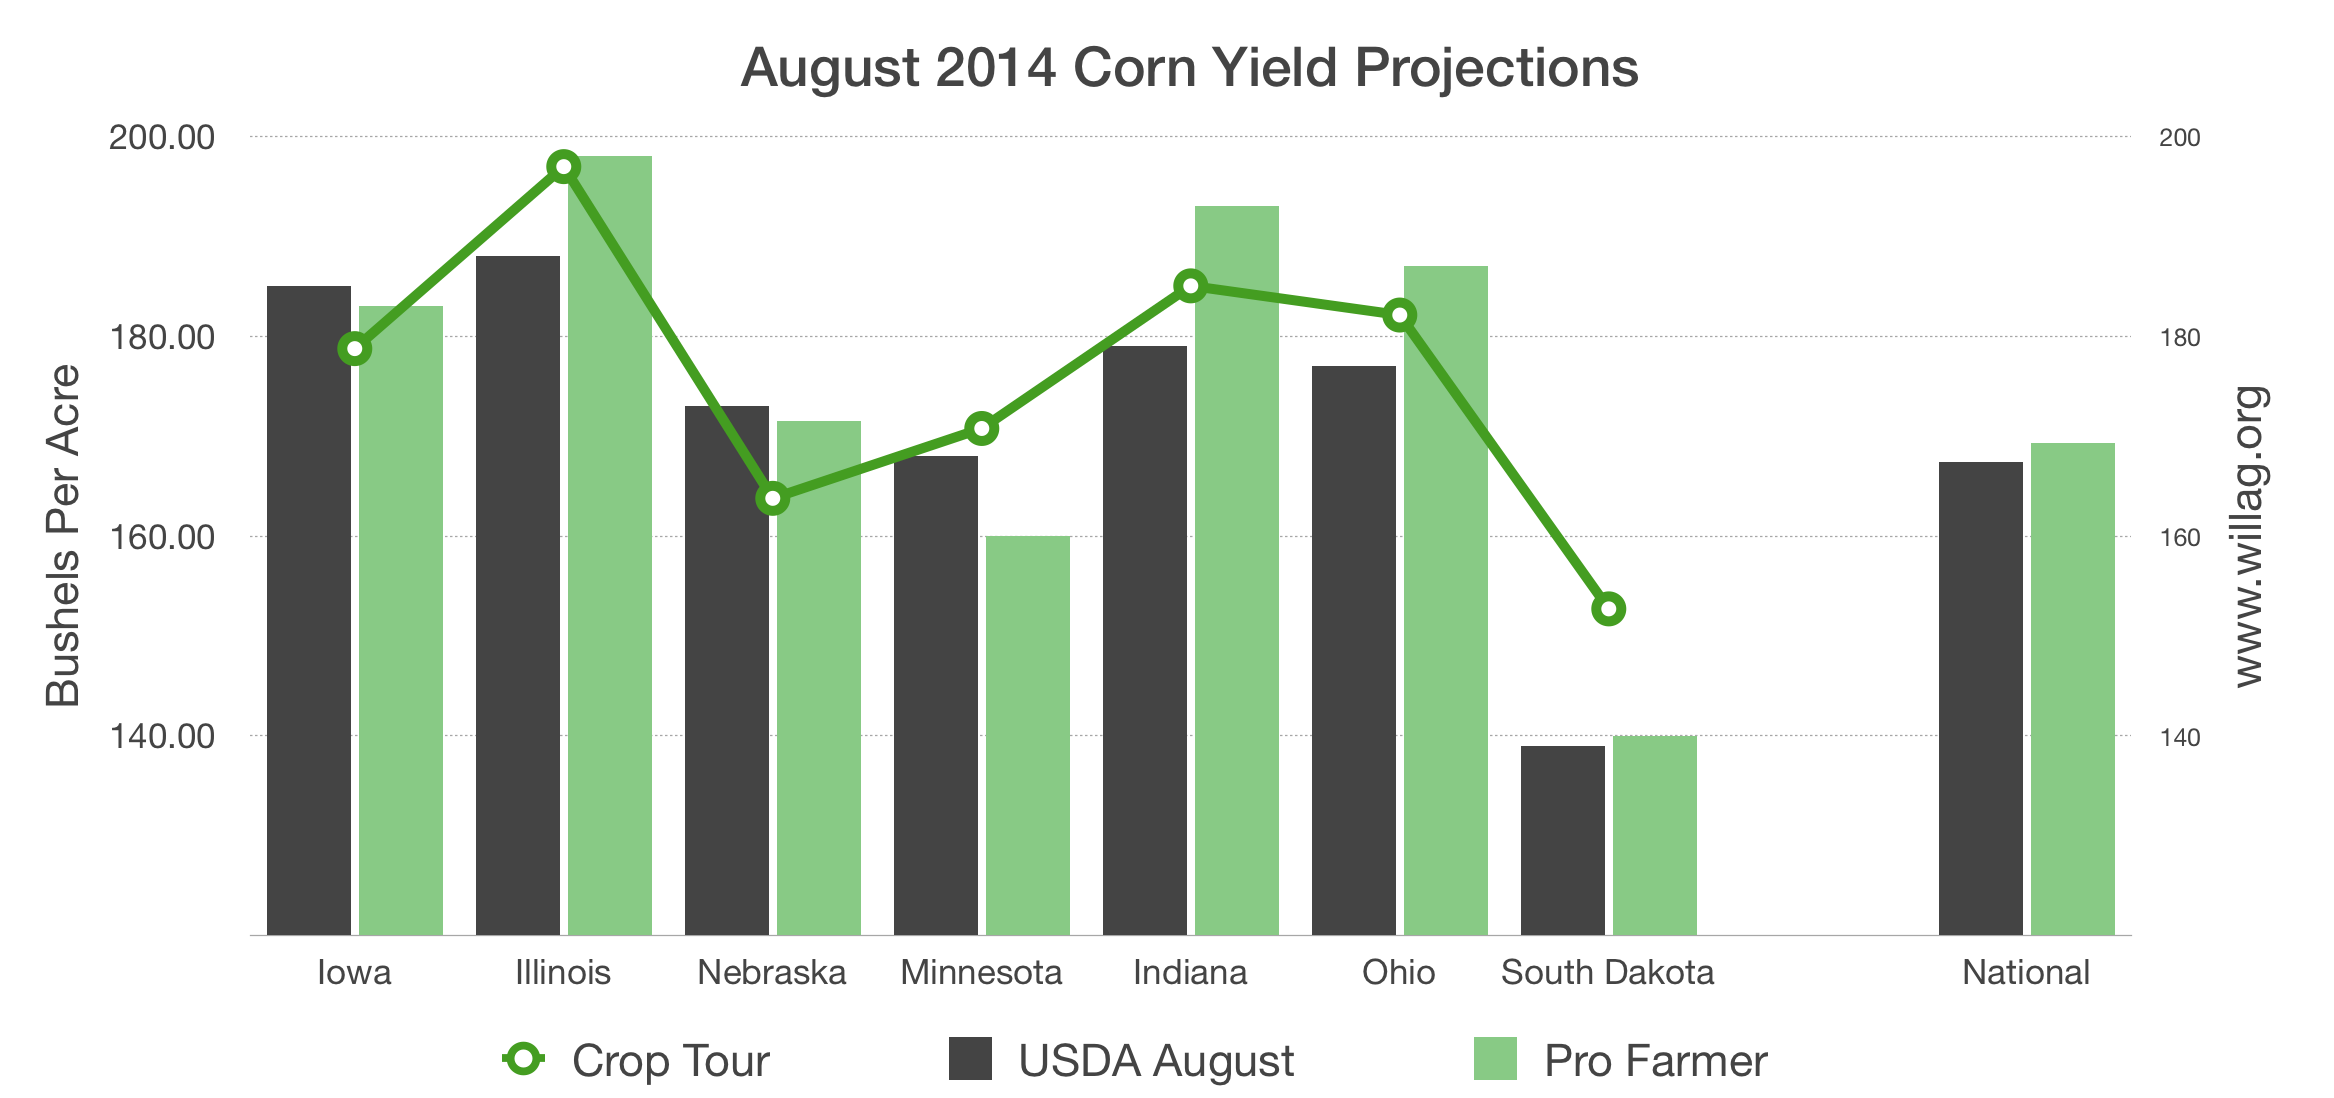
Pro Farmer Midwest Crop Tour results are plotted here against the United States Department of Agriculture National Agricultural Statistic Service corn yield projections and the Pro Farmer Newsletter estimates. USDA NASS estimates are as of August 1, 2014 and the Pro Farmer crop tour yields were taken the week beginning Monday August 18. The Pro Farmer estimates were made August 22, 2014.
The final Pro Farmer Midwest Crop Tour estimates tallied corn and soybean yields across seven Midwestern states stretching through the primary corn growing counties in the United States. The tour is watched closely by those in the grain and oilseed trade. However, it should be noted USDA gathers much more objective and survey based information about the size of U.S. crops. 
--
2014 Midwest Pro Farmer Tour Results
Corn        Soybean      State
182.11     1342.42       Ohio
185.03     1220.79       Indiana
196.96     1299.17       Illinois
178.75     1173.59       Iowa
163.77     1103.26       Nebraska
170.76     1031.54       Minnesota
152.71     1057.80       South Dakota

ARC-CO and PLC Payment Indicator Using August WASDE U.S. Yield and Price

by Carl Zulauf, The Ohio State University & Gary Schnitkey, University of Illinois
The 2014 farm bill gives Farm Service Agency (FSA) farm owners the option to choose their crop program for the 2014 through 2018 crop years. A factor, perhaps key factor that will influence this decision is the payment by the program choices for the 2014 crop year. This article uses the just released U.S. yield and price estimates in the August 2014 World Agricultural Supply and Demand Estimates (WASDE) to calculate an indicator of potential payments by the Agriculture Revenue Coverage - county program (ARC-CO) and the Price Loss Coverage (PLC) program. The indicator estimates are for the 2014 crop year for barley, corn, oats, long grain rice, medium (and short) grain rice, sorghum, soybeans, and wheat.  These are indicator estimates because they use U.S. yield not county yield or farm payment yield, as ARC-CO and PLC use, respectively.  AR-CO payments, for example, will vary across counties, with some counties having no payments due to high yields and some counties having large payments due to low yields.  Thus, this article is not estimating payments that an individual FSA farm owner would receive.  Nevertheless, the indicator estimates using U.S. yields should help frame questions and perspectives for FSA farm owners regarding program choices.
Calculation of Estimated Program Payments
ARC-CO makes payments when county revenue for the crop year is less than 86% of the county's benchmark revenue.  ARC-CO pays when actual revenue is between 76% and 86% of benchmark revenue.  PLC makes payments when the U.S. crop year average price is less than the crop's reference price.  The reference price is

Ag Economist Darrel Good Discusses August USDA Reports

Four Items of Interest for the Week of August 10, 2014

U of I Agronomy Day Thursday

A note for the weekend with four items from Todd Gleason ACES / Extension / WILLAg.
  1. Check out WILLAg's Commodity Week! I tried an experimental format and would like to know what you think. Panelist included Matt Bennett, Jacquie Voeks, & Mike Zuzolo. Shoot me an email with your thoughts - tgleason@illinois.edu.
  2. Watch your email for WILLAg's Crop Production & WASDE Newsletter special from Dave Dickey. The reports are due out from USDA at 11am central Tuesday.
  3. Thursday is Agronomy Day on the University of Illinois campus in Urbana-Champaign. Todd will emcee the day on the south farms just east of the State Farm Center (the Assembly Hall) on St. Mary's road. See details a bit further down.
  4. Thursday night kicks off the fall WILLAg Outlook Panel schedule in Shelbyville. The details are slow coming in on that one, but check out this webpage Monday for the finalized event.
Todd Gleason
(217) 333-9697
twitter @commodityweek

--

Thursday August 14, 2014 - 7am-Noon

Explore the latest breakthroughs in agriculture and technology with researchers and Extension specialists from the University of Illinois this Thursday at the University of Illinois south farms research plots. The day starts at 7am just to the east of the State Farm Center (Assembly Hall) on St. Mary's Road. Each tour lasts about an hour, so please come early if you plan to take all four tours. Field tours depart from the St. Mary's location, making stops at

Would You Eat GMO Sweetcorn


USDA says ARC/PLC Sign Up Winter 2015

Friday the United States Department of Agriculture Farm Service Agency made a series of announcements related to the new farm programs' signup period. Farmers will make final irrevocable decisions between the ARC & PLC programs sometime after January 1, 2015.

timeline posted to USDA FSA website August 1, 2014
Letters are in the mail this month notifying farm operators of current base acres and yields, along with 2009-2012 planting histories. The letter asks these numbers be confirmed or updated as the first part of the sign up process. 

Online tools are under development at the University of Illinois to aid producers throughout the nation. Those tools may be ready by the official end of summer (September 22, 2014), but have not yet been released.

The following note was posted the USDA FSA website August 1, 2014;

WASHINGTON, Aug. 1, 2014 — U.S. Department of Agriculture (USDA) Farm Service Agency (FSA) Administrator Juan M. Garcia announced today that farmers should start receiving notices updating them on their current base acres, yields and 2009-2012 planting history. The written updates are an important part of preparing agricultural producers for the new safety net programs established by the 2014 Farm Bill.

“We’re sending these reports to make sure that farmers and ranchers have key information as they make critical decisions about programs that impact their livelihood,” said Garcia. “It’s important that producers take a few minutes to cross check the information they receive with their own farm records. If the information is correct, no further action is needed at this time. But if our letter is incomplete or incorrect, producers need to contact their local FSA county office as soon as possible.”

Verifying the accuracy of data on a farm’s acreage history is an important step for producers enrolling in the upcoming Agriculture Risk Coverage (ARC) program and the Price Loss Coverage (PLC) program. Later this summer, farmers and ranchers will have an opportunity to update their crop yield information and reallocate base acres.

“We’re working hard to prepare and educate farmers on the new programs created by the 2014 Farm Bill,” added Garcia. “I encourage producers to bring their USDA notice to any scheduled appointments with the local FSA county office. This will help ensure they have the information they need with them to discuss the available program options.”

By mid-winter all producers on a farm will be required to make a one-time, unanimous and irrevocable election between price protection and county revenue protection or individual revenue protection for 2014-2018 crop years. Producers can expect to sign contracts for ARC or PLC for the 2014 and 2015 crop years in early 2015.

Covered commodities include barley, canola, large and small chickpeas, corn, crambe, flaxseed, grain sorghum, lentils, mustard seed, oats, peanuts, dry peas, rapeseed, long grain rice, medium grain rice (includes short grain rice and temperate japonica rice), safflower seed, sesame, soybeans, sunflower seed, and wheat. Upland cotton is no longer a covered commodity.

It is True – 20% of the Farms Produce Most of the Value

The 2012 Census of Agriculture hold many unique facts. Researchers at the University of Illinois have been digging through the numbers to find some plumbs. Todd Gleason reports it seems an old adage is borne out by the figures.

There were about 75 thousand farms in Illinois when the 2012 Census of Agriculture was taken by the United Stated Department of Agriculture. The census, by two different measures – acreage operated & value of production – suggests the majority of Illinois farms are small by either categorization. However, there are two interesting facts that flow with these categorizations. The smaller the farm the more likely it is to produce livestock of less total value, and the larger the farm the more likely it is to produce crops – mostly grains and oilseeds - of much greater value.

The Census of Agriculture defines a farm as any place from which $1,000 or more of agricultural products were produced and sold, or normally would have been sold, during the reference year. The Census classifies each farm's production specialization based on the North American Industry Classification System (NAICS). A "Livestock" farm is

Storing the 2014 Corn Crop

URBANA, IL. – The majority of annually produced crops such as corn obviously have to be stored. According to a University of Illinois agricultural economist, for corn producers, the question at harvest time will be who will store the portion of the crop which has not yet been sold.


“The portion of the crop that has not been sold can be sold at harvest for someone else to store, or the producer can store the crop on the farm or in commercial facilities,” said Darrel Good. “For the portion of the crop stored by the producer, the second question is whether the stored crop should be priced for later delivery or held unpriced. That decision is influenced by the magnitude of the carry in the corn market, the cost of storage, and expectations about the change in corn prices after harvest.”

Good explained that for corn that is stored and priced for later delivery, the price for later delivery needs to

Will Crop Insurance Make Payments in 2014?


by Gary Schnitkey, University of Illinois

In Illinois, crop insurance payments on corn likely will be lower in 2014 than in 2012 and 2013. Crop insurance payments in 2014 likely will not be large for soybeans. For both corn and soybeans, harvest prices will be lower than projected prices. However, above average yields likely will counter price decreases, leading to low crop insurance payments. Somewhat ironically, crop insurance payments likely will be lower in 2014 than in 2012 and 2013. At the same time, revenue and returns will be much lower in 2014 than in 2012 and 2013.

Product Choices of Farmers

In this article, focus is placed on revenue insurance products at high coverage levels, as most farmers purchase these products. The four revenue products available in

Fish Farm Challenge

The National 4-H Foundation and Monsanto have put together an educational series for kids at summer camp. Learn how the Fish Farm Challenge is helping boys and girls understand world hunger, world population, science, and engineering.

EPA Administrator McCarthy Speech to Agriculture

SPEECH EXCERPTS from U.S. EPA Administrator Gina McCarthy's July 10, 2014 speech on the Clean Water Act proposal that United States agricultural interest fear will broaden the 'navigable waters' definition leading to greater governmental regulation of farm ditches, etc.
--

Today, I’m here to talk about our Clean Water Act proposal, which was called for by the Supreme Court and by numerous state organizations, as well as numerous agriculture stakeholder groups. The aim of this proposal is clear: to clear up legal confusion and protect waters that are vital to our health, using sound science so that EPA can get its job done. It is crucial that we keep farmers and the ag industry as a whole doing what they do best: producing the food, fuel, and fiber that provide for our American way of life. The kinds of water bodies we’ll protect provide drinking water to 1 in 3 Americans.
###

We agree that people have a right to healthy land and clean water, so we have to make sure people understand that the practices we put in place are reasonable and consistently applied. That’s how we make sure everyone is playing by the same rules, and that everyone can fully work their farms and ranches with confidence and certainty. All of us rely on science and accurate facts. Farmers need to know what to plant and when to plant it, and EPA needs to know how to protect our precious water resources for everyone to enjoy. So it’s great to be here to talk facts and roll up our sleeves to work together to benefit producers and public health.
###

Yesterday, we heard very clearly some of the concerns about our proposed rule. Let me clear up some of that: We heard fears that EPA is regulating groundwater. This is not true; groundwater regulations do and will fall under the purview of the states. EPA is not regulating all activities in floodplains, or every puddle, dry wash, and erosional feature. In fact, we’re doing just the opposite. If cattle cross a wet field – let them. That’s a normal farming practice, and all normal farming practices are still exempt. The bottom line is – if you didn’t need a permit before this proposed rule, you won’t need one when it’s finalized.
###

So let’s talk about the interpretive rule and the 56 conservation practices that are good for production and good for water quality. That rule seems to have generated lots of confusion. So, why did we want to list out those 56 practices? Those 56 are an attempt to clear the path for slam dunk conservation practices. We did not narrow exemptions; those 56 are a subset to the existing exemptions for normal farming, ranching, and silviculture. No one should have to think twice about taking advantage of these conservation practices.

Some mistakenly think that this means additional federal standards with which to comply, but that’s wrong. Conservation practice standards are not federal regulatory standards. They just provide a roadmap for producers to make sure they’re squeezing all they can out of their practice.

New exemptions are “self-implementing,” which means no one needs to notify or get approval from EPA or the Corps. There’s no need to double check with anyone at any time. I’m sure farmers agree that the best discussion on jurisdictional determinations is one that never needs to happen. We added 56 exemptions because we want to boost conservation without boosting bureaucracy. Is the interpretive rule the best way to do that? Let’s figure that out together. I am about outcomes, not process. 

What if this is an 173.6 bpa year?

This week University of Illinois ag economist Scott Irwin and Darrel Good have posted an article to the farmdocdaily website. It poises the question of just how big a really big United States corn yield could become. The answer, based on past history, is 173.6 bushels to the acre. 

That's the average bpa deviation of the previous 6 largest deviations from trend yield since 1960. Those are shown in the included graph. The largest percentage deviation in the trend came in 1972 at 15.2 percent. 

While the crop conditions reported by USDA each Monday support the potential for such a record setting national average yield for corn, the two caution this year does not following the normal pattern of the other six. The normal pattern is for near or just above normal rainfall and lower than average temperatures in the three I states; Iowa, Illinois, and Indiana. However, the number one corn producing state of those three (and the nation), Iowa, had nearly twice the June rain. 

"There is no historical precedent in the last five decades for an extremely high corn yield relative to trend (1972, 1979, 1982, 1985, 1986, 1987, 1994, 2004, and 2009) when Illinois, Indiana, or Iowa had such an extreme amount of precipitation during June" write the two ILLINOIS agricultural number crunchers. They add, "the same conclusion also holds when other major corn-producing states are included in the analysis". 

It doesn't mean such an exception won't occur, but rather that it has not happened before. History points to record yields with cooler, wetter weather runs through August. 

Risky Business Study with Cargill's Greg Page

A group of business people and political leaders have released a project called Risky Business. University of Illinois Extension's Todd Gleason has more on the study and how it might be used in the Midwest to assess and mitigate the financial risk associated with climate change with Cargill's Chairman of the Board Greg Page.

Click on the arrow below to listen to the interview. You may visit www.riskybusiness.org for more complete details of the study.


Check out the corn and soybean field conditions in this little video from the Gleason Farms in Logan County, Illinois. The corn looks, well, GREAT - and the soybeans are flowering! 


June 30, 2014

USDA released the annual Acreage and quarterly Grain Stocks reports at 11am central time today.


ACREAGE

Corn Planted Acreage Down 4 Percent from 2013
Soybean Acreage Up 11 Percent
All Wheat Acreage Up Less Than 1 Percent
All Cotton Acreage Up 9 Percent

Corn planted area for all purposes in 2014 is estimated at 91.6 million
acres, down 4 percent from last year. This represents the lowest planted
acreage in the United States since 2010; however, this is the fifth largest
corn acreage in the United States since 1944.

Soybean planted area for 2014 is estimated at a record high 84.8 million
acres, up 11 percent from last year. Area for harvest, at 84.1 million acres,
is up 11 percent from 2013 and will be a record high by more than 7.4 million
acres, if realized. Record high planted acreage is estimated in Michigan,
Minnesota, Nebraska, New York, North Dakota, Ohio, Pennsylvania, South
Dakota, and Wisconsin.


GRAIN STOCKS

Corn Stocks Up 39 Percent from June 2013
Soybean Stocks Down 7 Percent
All Wheat Stocks Down 18 Percent

Corn stocks in all positions on June 1, 2014 totaled 3.85 billion bushels, up
39 percent from June 1, 2013. Of the total stocks, 1.86 billion bushels are
stored on farms, up 48 percent from a year earlier. Off-farm stocks, at
1.99 billion bushels, are up 32 percent from a year ago. The March - May 2014
indicated disappearance is 3.15 billion bushels, compared with 2.63 billion
bushels during the same period last year.

Soybeans stored in all positions on June 1, 2014 totaled 405 million bushels,
down 7 percent from June 1, 2013. On-farm stocks totaled 109 million bushels,
down 36 percent from a year ago. Off-farm stocks, at 296 million bushels, are
up 12 percent from a year ago. Indicated disappearance for the
March - May 2014 quarter totaled 589 million bushels, up 4 percent from the
same period a year earlier.

Old crop all wheat stored in all positions on June 1, 2014 totaled
590 million bushels, down 18 percent from a year ago. On-farm stocks are
estimated at 97.0 million bushels, down 19 percent from last year. Off-farm
stocks, at 493 million bushels, are down 18 percent from a year ago. The
March - May 2014 indicated disappearance is 467 million bushels, down
10 percent from the same period a year earlier.


Here are some other items of interest from the USDA Executive Summary.

The Change in Acreage by Crop (2013 to 2014)


2014 Principal Crops Planted
Acres (000) & Change from Prospective Plantings by state


U.S. Principal Crop Acres


Our website is also a great place to get updates. The address is www.willag.org. Todd's @commodityweek Twitter feed will be posted directly into the site and it will give a quick, if incomplete, review of the figures. The detailed numbers will be posted into the USDA Reports page on our online home.

Finally, thank you very much to all those helping to make our end of the fiscal year fund drive a great success. WILL is a public radio station and your financial support is vital. If you haven't yet, or simply would like to help support our agricultural programs on the station, including this newsletter, please do make a contribution. When you fill out the online forms be sure to write "in support of agriculture" in the comments section.

subscribe to this newsletter

unsubscribe to this newsletter

edit your existing subscription profile

Chris Hurt says Same Pounds of Pork & Same Corn Fed

Friday USDA released the Quarterly Hogs & Pigs report. During an interview late Friday afternoon Purdue Extension Ag Economist Chris Hurt said the figures show, as it relates to the amount of corn consumed by the nation's hog herd, the lower number of animals coming to market now because of PEDv is offset by heavier weights. Essentially, Hurt says feeding fewer pigs to heavier weights consumes about the same amount of corn (he thinks) and produces about the same amount of pork.


You may read Chris Hurt's thoughts on the livestock market once a month in The Weekly Outlook posted to the FarmDocDaily website during the noon hour on Mondays.

USDA June 2014 Grain Stocks & Acreage Reports

Grain Stocks

USDA June Estimate Average Ranges June 2013 March 2014
Corn 3,723 3,046-4,050 2,766 7,006
Soybean 382 334-440 435 992
Wheat 597 561-633 718 1,056

Acreage

USDA June Estimate Average Range March 2014 2013
Corn 91.709 91.00-92.50 91.691 95.365
Soybean 82.213 81.30-84.00 81.493 76.533
All Wheat 55.777 54.80-56.50 55.815 56.156
    Spring 11.937 11.30-12.20 12.009 11.596
    Durum  1.795   1.69- 1.90   1.799   1.470

Wheat Head Scab in SRW Crop


The nation's wheat crop is suffering from too much rainfall. It is causing harvest delays in the hard red winter wheat growing regions of the southwestern United States, and the development of disease issues in the southern Illinois soft red winter wheat crop.

Agronomy Day August 14, 2014

Visit the Agronomy Day Home Page now!

Art on the Roadside

Photographers call the time before sunset the golden hour. The light bends and shimmers across the landscape from a very low angle. It is a beautiful time of day to take pictures. 


You might say the sun paints the planet with golden light.


These photos were taken during my evening walk Sunday June 15, 2014 near my childhood home outside Elkhart, Illinois. They were shot facing the southeast with the sun directly at my back.


Nature does the best job of painting the landscape, however an app called Waterlogue helped me create an interesting artistic view of the art on the roadside.

ILLINOIS' Darrel Good on June WASDE

USDA WASDE Report

Hog Prices Take Big Drop: What Next?

Traders in Chicago have a better handle on a disease in the nation’s hog herd. Lean hog futures have responded by moving lower. Purdue Ag Economist Chris Hurt has more on why the price of pork is on the decline.

Visit a Grain Elevator on a Sunday Afternoon

Some Sunday this summer you should make the drive to Atlanta, Illinois and tour the old grain elevator. It stopped taking in corn long ago and sat unused for years. Then the townsfolk decided, in the mid 1990’s, to refurbish the J. H. Hawes Grain elevator. Today it is a museum on the registry of historical places in the United States. You can learn more on the museum website.
 

The J. H. Hawes Grain Elevator and Musuem is open to visitors from 1 p.m. to 3 p.m. every Sunday afternoon in June, July, and August. Here are few facts and figures about the machinery in the elevator.

  • the old gas engine that operates the elevator runs at 400 r-p-m and puts out 10 horsepower
  • the pulley system inside the building is driven by a single rope 280 feet long
  • the total capacity of the elevator is twenty-nine thousand bushels

All About PEDv

Skype Capable of Real Time Language Translation


Skype, now owned by Microsoft, may soon be able to translate speech in real time. The company demoed this new kind of magic on stage. It would allow people to converse in their native (but different) languages.

Skype is one of my favorite broadcast tools. I use it every day and cannot wait to see how it might handle a conversation translation about on farm conditions in China, Ukraine, Argentina, and Brazil.

The Last Post & Red Poppies

Flying Old Glory

Memorial Day we honor and remember those that gave their lives for freedom. Please remember to fly the U.S. flag at half staff until noon. Thee United States Flag Code lays out in detail when and how the flag is to be displayed along with other information. What follows is a short excerpt from the code.


The Flag Code — History and Text

On June 22, 1942, President Franklin D. Roosevelt approved House Joint Resolution 303 codifying the existing customs and rules governing the display and use of the flag of the United States by civilians. Amendents were approved on December 22nd of that year. The law included provisions of the code adopted by the National Flag Conference, held in Washington, D.C. on June 14, 1923, with certain amendments and additions. The Code was reenacted, with minor amendments, as part of the Bicentennial celebration. In the 105th Congress, the Flag Code was removed from title 36 of the United States Code and recodified as part of title 4.


Title 4 United States Code (excerpt)

6. Time and Occasions for Display.

  (a) It is the universal custom to display the flag only from sunrise to sunset on buildings and on stationary flagstaffs in the open. However, when a patriotic effect is desired, the flag may be displayed 24 hours a day if properly illuminated during the hours of darkness.

  (b) The flag should be hoisted briskly and lowered ceremoniously.

  (c) The flag should not be displayed on days when the weather is inclement, except when an all-weather flag is displayed.

  (d) The flag should be displayed on all days, especially on...

  • New Year’s Day,  January 1 
  • Inauguration Day, January 20 
  • Martin Luther King Jr.’s birthday, the third Monday in January 
  • Lincoln’ s Birthday, February 12
  • Washington’ s Birthday, third Monday in February
  • Easter Sunday (variable)
  • Mother’s Day, second Sunday in May
  • Armed Forces Day, third Saturday in May
  • Memorial Day (half-staff until noon), the last Monday in May
  • Flag Day, June 14; Independence Day, July 4
  • Labor Day, first Monday in September
  • Constitution Day, September 17
  • Columbus Day, second Monday in October
  • Navy Day, October 27
  • Veterans Day, November 11
  • Thanksgiving Day, fourth Thursday in November
  • Christmas Day, December 25
  • and such other days as may be proclaimed by the President of the United States
  • the birthdays of States (date of admission)
  • and on State holidays

  (e) The flag should be displayed daily on or near the main administration building of every public institution.

  (f) The flag should be displayed in or near every polling place on election days.

  (g) The flag should be displayed during school days in or near every schoolhouse.

Accuracy of USDA Forecasts of Corn Ending Stocks

Two University of Illinois ag economist have looked at the accuracy of USDA forecasts of corn ending stocks. You may read the full report on the accuracy of USDA ending stocks for corn on the Farm Doc Daily website. The post is written by Darrel Good and Scott Irwin.

In it the two summarize the accuracy of WASDE forecasts of marketing year ending stocks of U.S. corn from 1990 to last year’s harvest by marketing year. They also discuss the implications for the May 2014 WASDE ending stocks estimates that was just released by USDA.   Three main implications emerge.  First they report, WASDE ending stocks projections for U.S. corn across the forecasting cycle are basically unbiased, if having a slight tendency towards under-estimation of the final number. Second, the first WASDE estimate of ending stocks for U.S. corn, always released in May before harvest, has a large potential range of errors.  This is sensible since the ending stocks forecast at this early point in the forecasting cycle reflects both production and usage errors.  Third, there is a clear tendency for the USDA to "smooth" the changes in projections of year ending stocks later in the forecast cycle.

Here’s the bottom  line part for the price of old crop corn.

This tendency suggests the WASDE ending stocks forecast for the 2013-14 marketing year released earlier this month (1.146 billion bushels to be left in the bin this fall) may be over-estimated.  Intriguingly, this is the reverse of current market expectations that year ending stocks for 2013-14 will exceed the current USDA forecast. It is a price positive change.

Now let’s delve further into the report. Again the 2013-14 marketing year ending stocks are now forecast at 1.146 billion bushels.  Historical forecast errors suggest there is a 50 percent probability actual year ending stocks will be between 1.121 billion and 1.267 billion bushels.  There has been a slight bias towards under-estimating year ending stocks in this report in the past, with an average error of 49 million bushels.  This bias seems to support the market's expectation that USDA has over-estimated marketing year exports, and therefore, under-estimated year-ending stocks.

This last segment supports trade sentiment of a higher ending stocks number for corn and this would put pressure on price to go lower.

However, some previous University of Illinois analysis suggests errors in forecasting year ending stocks late in the marketing year are more highly correlated with errors in forecasts of feed and residual use. There is a positive relationship between the change in the ending stocks forecast in May and the error in the May forecast. If the May ending stocks number goes up, it is more likely to be an associated with an even larger final ending stocks figure. The same is true if it goes down. If the April to May WASDE ending stocks figure falls, then it is associated with an even smaller final ending stocks figure.

While the fit is not great, the relationship is interesting write Darrel Good and Scott Irwin. You may read their work on the Farm Doc Daily website.

ILLINOIS' Darrel Good Not Convinced Corn Prices Should Go Lower


USDA’s latest projections raised corn exports by one-hundred-fifty million bushels. It means shippers will need to load-out a lot of corn over the next three months says University of Illinois Ag Economist Darrel Good.

The ILLINOIS number cruncher wrote about corn consumption in his May 12, 2014 Weekly Outlook, "Although other factors may have contributed, corn prices declined following the release of the new WASDE ending stocks projections. Given the surprisingly large level of consumption of U.S corn that has unfolded this year and planting season weather that may pose a threat to both planted acreage and yield in some areas, the price weakness appears to be premature".

 Read more from Darrel Good's article on the FarmDocDaily website.

Political Support for Bio-Diesel


Support for biodiesel made from soybeans is coming to a head in Washington, D.C. Farmers, politicians, and biodiesel producers want continued support of the renewable fuel.

EPA's McCarthy Understands Corn Relies on the RFS


New RFS rules are likely to be released in June. Todd Gleason reports EPA believes it understands the importance of the rule to the nation's corn farmers.

Yield Loss & Delayed Planting


University of Illinois Extension Agronomist Emerson Nafziger has penned an article on delayed planting and yield loss. You can read it online http://t.co/6coHa5jIBc


Glauber on the U.S. Grain & Oilseed Supply

USDA's Joseph Glauber talked with members of the National Association of Farm Broadcasting earlier this week. The discussion considered ending stocks, rebounding corn and soybean supplies, exports, and the Lock Up.

Washington Watch

This week I am working from the farm broadcaster's annual spring event in Washington, D.C.

Arrived Reagan National at 11:29 today. Was checked into the hotel and having lunch within 40 minutes thanks to a quick ride on the light rail line. The left of this photo shows the subway entrance near my hotel and the food trucks.

I overheard someone saying they followed the Gyro truck online and that it had been a week since it was at this station.

Delicious lunch choice for $7.00.


More Illinois Counties Confirmed Cry3Bb1 WCR Resistant

SOIL INSECTICIDE + Bt PYRAMID A BAD IDEA The resistance is getting stronger in Illinois. It's been just over a decade since the introduction of Bt hybrids capable of fending off the western corn rootworm. University of Illinois Extension Entomologist Mike Gray says six counties in the state are affected, with more to come.

Palmer Amaranth Untreatable 10 Days after Emergence

University of Illinois Weed Scientist Aaron Hager is urging farmers to diligently control a new weed species in the state. Palmer amaranth plants reached a 4-inch height less than 10 days after emergence. Palmer is very hard to control after it is taller than four inches. You can read more from Aaron Hager on the weed in The Bulletin.
photo comparing the growth rate of waterhemp vs palmer amaranth
This greenhouse demonstration compares the growth rate of  palmer amaranth compared to waterhemp at 4 days post emergence and 16 days. Palmer becomes nearly untreatable after reaching a height of 4 inches, usually less than 10 days after emergence.


State of Overwintering Row Crop Insect Pests

Tough to Predict U.S. Growing Regions Weather


There are a handful of meteorologists on the planet that follow weather in all the places farmers grow commodity crops like corn, soybeans, wheat and rice. Each is likely to tell you the most difficult forecast to produce is for the Midwest.

Visit tStorm Weather's Website

Check out Farmers from around the Globe

Farmer Derek Klingenberg likes to make videos. He does a great job. #WeAreFaming

CME Grain & Oilseed Trading Limits to Change Regularly

The CME Group Inc said today it will implement a new system for setting daily price limits for U.S. grain and oilseed futures starting next month. It will regularly change the limits to markets including corn, soybeans and wheat. These will reset twice a year with the change based on underlying price levels. CME will also remove price limits for all grain and oilseed options.

Both changes are set to take effect the first trading day of May which begins the evening of Wednesday April 30th. The semi annual adjustment of the limits will widen the trading range during periods of higher prices and narrow the limits when market prices are lower.

The reset dates will be the first trading day in May and the first day in November.

On May 1, the initial daily limit for corn will drop to 35 cents a bushel from 40 cents, rise to $1.00 from 70 cents for soybeans, and drop to 45 cents a bushel from 60 cents for CBOT soft red winter wheat.


10pm on Saturday Night

It can be lonely on the farm. However, it sure looks like Twitter is letting guys striving for the same thing talk in realtime when they're busy. This 'screen shot' is a 10pm Saturday night conversation from a western Illinois farmer. He simply asked for a roll call of who was still in the field. The answers came back from across the Midwest.


No Signs of Weakening Soybean Exports

U.S. grown soybeans are being shipped out of the nation at an astounding pace and, as you'll hear from University of Illinois Ag Economist Darrel Good, there doesn't appear to be any slowdown in the movement.   

Corn Consumption Continues to Exceed Projections


Farmers are going to the field this spring feeling much better about the price of corn. Todd Gleason has more on the reasons why things have gone from dire to acceptable.

Forward Figuring Corn & Soybean Ending Stocks

The March reports released by the United States Department of Agriculture can be used to estimate how much corn and soybeans will be left in the nation for this fall and next. Todd Gleason has more on the calculations from the University of Illinois.

USDA April 9, 2014 World Agricultural Supply & Demand Estimates

Bt Resistance Rant

April 3, 2014 Mike Gray posted a note into the University of Illinois IPM bulletin about the addition of three more counties to the Yieldgard resistant western corn rootworm saga. The Entomologist also reprimanded the industry for not taking academic recommendations on management of GMO products seriously a decade ago. You may read the FULL ARTICLE here, and an excerpt below.

"While the greater implementation of best management practices is a step in the right direction — let’s be clear, these practices should have been in place when Bt corn rootworm hybrids were first used over 10 years ago. Accelerated reliance upon the pyramided Bt rootworm products with reduced seed blend refuges will not solve this resistance management challenge. Increased use of soil insecticides, along with Bt rootworm hybrids, will likely only exacerbate resistance development. As I have done in the past, I urge producers to implement a long-term integrated pest management approach for corn rootworms. This includes the use of multiple tactics (over time, not all in the same season), such as: use of a more diverse crop rotation system, use of a non-Bt hybrid in conjunction with a planting-time soil insecticide, rotation of pyramided Bt hybrids, and consideration of an adult suppression program in heavily infested fields."