Posts

Showing posts with the label Illinois

Prevented Plant Impacts on 2019 Illinois Grain Farms Incomes

link to farmdoc Daily article

In 2019, spring weather was very wet, and many farmers in Illinois had prevented plant (PP) acres. Compared to 2018 incomes, 2019 incomes declined more for those farms that had a larger proportion of their acres in PP. While some have suggested that PP payments may overcompensate farmers, the income results presented in a new paper from the University of Illinois do not support the contention. Todd Gleason has this discussion with ag economist Gary Schnitkey.


Farms Included in Study

Table 1 shows 2018 and 2019 incomes on Illinois grain farms enrolled in Illinois Farm Business Farm Management (FBFM). To be included in Table 1, a farm had to meet the following criteria:
  • Receive the majority of their incomes from grain operations,
  • Have over 500 acres, and
  • Have records that were certified useable by Illinois FBFM staff in both 2018 and 2019.
A total of 1,483 farms meet these criteria, with results for all farms given in Panel A.
For all farms, tillable acres averaged 1,525 per acre, with a range of 500 acres to over 13,000 acres. Net farm income averaged $184,460 in 2018, declining by 51% to $89,866 in 2019 (see Panel A of Table 1)


Income Declines as Percent Prevented Plant Acres Increases

In Panel A, the 1,483 farms are divided into five categories based on the proportion of PP acres. In 2019, 73% of the farms had no PP acres. Even given the wetness of 2019, most Illinois grain farms planted all acres in 2019. Still, of the farms in this sample, a sizable proportion (26%) has some PP. Of those farms that had PP, 15% had less than 10% of their acres in PP. Percentage of farms then declines as the proportion of PP acres increased: 8% had between 11 and 30% of acres in PP, 2% had between 31% to 50%, and 4% had over 50%.
Incomes declines became more negative as the proportion of acres of PP increased, as shown in the last column in Panel A of Table 1. With no PP, the average income change was –45% from 2018 to 2019. The income change was
  • –53% when PP when less than 10%,
  • 97% when 11% to 30% of acres were PP,
  • –103% when 31% to 50% of acres were PP, and
  • –112% when over 50% acres were PP.
On average, net incomes in 2019 were negative when over 31% of acres where PP: -$3,832 per farm when PP was between 31% to 50%, and -$12,638 when PP was over 50% of tillable acres.
Incomes in Table 1 include all sources of revenue, including that from additional government payments offered in 2019 to counter incomes lost due to trade difficulties. Market Facilitation Program (MFP) payments are included in revenue (farmdocDaily, July 30, 2019). Also included is the 10% increase in PP payments.

Income Declines by Region in Illinois

Northern Illinois had more delayed planting than other areas of Illinois. Only 43% of the farms located in northern Illinois got all their acres planted, compared to 81% for central Illinois and 60% for southern Illinois. Over 10% of northern Illinois farms had over 30% of their acreage in PP (6% in 315 To 50% and 4% in over 50% categories) Income declines were larger in northern Illinois than in other parts of Illinois. The average income change in northern Illinois was –76%, compared to –45% for central Illinois and 53% for southern Illinois.

Commentary

The above results do not present an analysis of whether taking PP or planting was the correct decision. To conduct that PP/plant comparison, one would have to link up farms with the same growing conditions who made different PP/plant decisions and then see corresponding results. In this article, we compare incomes with different levels of PP. Given the reluctance of Illinois farmers to take PP, we assumed that most farmers who took PP had no alternative but to take PP. 
There has been some thought that PP payments may provide more than adequate compensation (see Brasher, https://www.agri-pulse.com/articles/12390-coverage-changes-could-limit-prevent-plant-payout ). In 2019, for example, the Risk Management Agency lowered the standard PP payment factor on corn from 60% of the guarantee to 55% (see Risk Management Agency, https://www.rma.usda.gov/en/News-Room/Frequently-Asked-Questions/Prevented-Planting-Coverage-Factor-Changes-for–2019 ). As incomes decline with more PP, income results in this article do not support the contention that PP provides overcompensation. Of course, results could vary by across years.

Dicamba | Too Hot to Spray

Farmers and retailers have been under pressure this season to get herbicides applied to soybeans and it has caused a lot of headaches. A Ninth Circuit Court of Appeals ruling caused a five-day pause in the application of three of the four available dicamba products. In Illinois, unlike other states, that pause was upheld and then the state tried to remedy the situation by adding five days to the application window - which now closes June 25th. Mostly it is going to be too hot spray during that time frame. Another regulation prohibits application on days warmer than 85 degrees says University of Illinois Extension Weed Scientist Aaron Hager, “Looking at the long term forecast from the National Weather Service, it looks like the next five days will be a no-spray situation. We’ve high temperatures well in excess of 85 degrees for today, Friday, Saturday, Sunday, and on into Monday. So, of the seven days we have left, it looks like on the extended forecast there may be only about two days.”

Regulations require the forecast to be checked within 24 hours of the intended application says the ILLINOIS Extension Weed Scientist, “The forecast can change over time but it looks like, at least for the next several days, we are going to have to leave the Dicamba sprayers parked.”

That’s for the Dicamba resistant soybeans. Other soybeans just look awful. There have been herbicide products for decades that burn the leaves of soybeans and then they grow out of it but this year’s damage is, well, in a word serve. Again, here’s ILLINOIS’ Aaron Hager, “A couple of possible reasons why that could be the case. 1) The environmental conditions, obviously, when these were applied. If they are applied under very warm air temperatures under bright sunshine we tend to see more soybean response compared with applications that happen under cooler and perhaps cloudy skies.”

The other possible explanation lies in the practice of adding a residual herbicide into the post-application herbicide mix. Hager says some of the residual herbicides could be acting in the tank mix like an additional crop oil. This would lead to a more rapid uptake of the herbicide and a consequently quick and extensive development of the burning leaf symptoms.

Returning to Dicamba soybeans. Illinois farmers unable to make applications by June 25th will need to use alternative products; Glyphosate, PPO inhibitors, or both. The problem is that waterhemp is likely to be resistant to one of the two, and maybe both. If that is the case, Aaron Hager says there are no good chemical options for the field.

Planting Corn and Soybeans in 2020


by Emerson Nafziger, ILLINOIS Extension Agronomist

March rainfall in Illinois ranged from normal to a couple of inches above normal, but the last week of March and first week of April have been relatively dry, and field operations are getting underway. The April 6 NASS report indicates that there were 3.1 days suitable for fieldwork in Illinois during the week ending on April 5, but no planting was recorded. As is often the case in early April, soils are wet over most of the state.

The 4-inch soil temperatures at 10 AM have been close to 50 degrees in southern Illinois, and over the past week they have increased from the low 40s to the mid–40s in central and northern Illinois. The forecast is for a return to cooler weather later this week, and possibly to wetter conditions as well. Such “yo-yoing” is normal for April, and it often brings up questions about what to do when the weather forecast is for conditions to deteriorate as planting approaches. Do we plant or do we wait?

There is no question that the ideal is for seed of both corn and soybean to be planted into soils that are relatively dry, and that are warm (and warming) enough to allow germination and emergence to get started quickly, and plants to grow steadily after emergence. The most recent example of the benefits of this was in 2018, when planting was delayed until May, then May weather was very warm, and the crops “never looked back” on their way to new yield records. In 2017, early corn planting was followed by a week of cool, wet weather, which led to a lot of replanting. The replanted crop often yielded more than the first crop, almost certainly because it had warmer conditions under which to germinate and begin to grow.

Having soils stay dry after early planting into cool soils is much better than having them turn wet: the germination process is very slow at low temperatures, so seeds will bide their time until soils warm up, and dry soils are a safer place to do that. If it turns wet, seeds will last longer in cool soils than in warm ones, both because low temperatures delay the germination process (and the demand for oxygen), and because colder water contains more oxygen than warmer water. Still, seeds that spend a week or more in wet soils at temperatures in the low 40s are subject to “imbibitional chilling injury” that can mean abnormal growth and poor emergence even if seeds survive. This is considered more of a problem in corn than in soybean, in part because more soybean seeds than corn seeds tend to die under such conditions and so don’t show those symptoms.

Planting date
Now that we’ve passed the first week of April, plantings of this year’s corn or soybean crops from now on can’t be considered “very early”, but the message from some agronomists about the need to plant soybeans as early as March continues, and more producers are choosing to begin planting soybeans before they begin planting corn. With planting date responses for the two crops essentially identical on a percentage basis, which crop to start with is more or less a tossup. The deciding factor in that case should often be which fields are ready first. Fields where soybeans grew last year will often be in good shape to plant earlier than those where corn grew, and that may mean planting some corn first. It certainly makes little sense to plant soybeans when it’s too wet just to plant them earlier than corn.

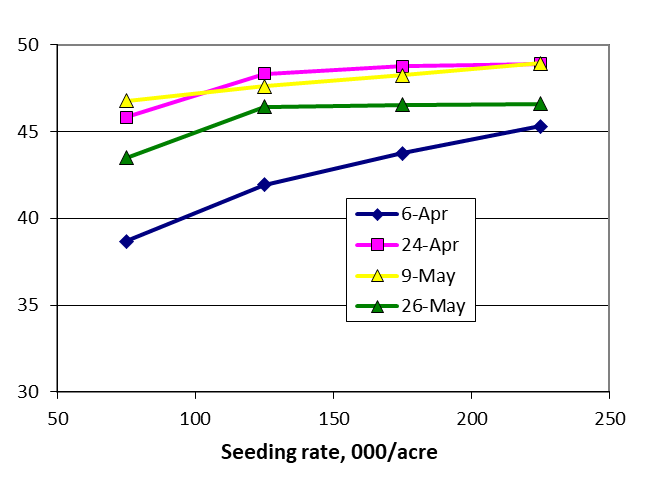
I have mentioned before the possibility that soybeans planted very early—in March or early April—might occasionally yield less than those planted in late April or early May. I dug up some data from a study that we did back in 2001–2003 in which we started planting as soon as we could (without planting in mud) using different seeding rates and varieties with different maturities. Figure 1 shows yields from this study, with planting date averaged over sites. Yields were not as high as we’d expect today, but the earliest planting yielded the least of all the planting dates. This was not due to low stands, with the exception of the Urbana site in 2001, when it froze (temperatures in the upper 20s) just as the crop was emerging, and about half of the plants from the first planting date were killed. We had five sites in southern Illinois, where average yields were even lower, but the earliest planting there (average of April 15) yielded less than either the early May or late May planting.


Figure 1. Soybean planting date responses over nine trials in central/northern Illinois, 2001–2003.

While changes in seed quality, spring weather, and perhaps genetics have lowered the threat of such losses from very early planting, we can’t rule out the possibility that planting soybeans in March or early April may not always maximize yield. That’s not necessarily because of stand loss from frost or wet soils. Frost can typically kill soybean plants only in a one- or two-day window as the plants are breaking through the soil surface. Frost that occurs after the first two leaves unroll can kill the growing point, but then buds will break and form (usually two) new stems. Most low stands in soybeans follow heavy rainfall soon after planting, and chances of that happening are not closely tied to when the crop is planted. Instead, the evidence is that low temperature stress during early growth may limit node and seed number per plant, therefore limiting yield potential. The fact that the earliest planting in northern Illinois responded so much to seeding rate reflects the fact that these plants did not have as many seeds as those planted later.

One of the incentives to plant soybeans very early is that some seed companies provide free replant seed. I do not know if “free” includes the cost of seed treatments (for replant seed) that are commonly applied to soybean seed at the point of sale. Soybean seed meant for early planting is often treated with several plant protectants, including ILeVO® for decreasing the incidence of SDS. That disease is generally considered more likely to be a problem when soybeans are planted into cold soils.

The debate among agronomists regarding the merits of planting soybeans in March or early April—before the start of corn planting—is still alive, but focusing on “corn versus soybean” as if it’s a contest mostly misses the point. Both corn and soybean benefit from early planting most of the time, and both face similar risks when conditions deteriorate after we plant early. We shouldn’t decide when to start planting or which crop gets priority based on how “tough” each crop is or on trying to prove someone wrong. The goal instead is to minimize risk and to maximize yield potential. The 2019 growing season was such that that penalty from late planting was relatively less for soybeans than for corn. That doesn’t mean that corn should get first planting priority this year. Both crops should get priority, with actual planting order determined by factors such as logistics, how fast fields dry, and crop insurance.

Recent research on how both corn and soybeans respond to planting date in Illinois is summarized below in Figure 2. I’ve shown both lines on the same figure before, but here I’m including the actual data for both crops along with the curves in order to show how variability changes as planting is delayed. While we did not try to plant soybeans before mid-April in this study, note that hardly any of the April soybean plantings produced less than maximum yields in these trials. With mid-April plantings yielding the same as late-April plantings, it seems unlikely that yields from planting in March would have been higher than those from planting in April.


Figure 2. Corn and soybean planting date responses in Illinois trials. Each trial included four planting dates, and yields were converted to percent of the maximum yield in that trial.

Unlike soybean, the earliest planting dates for corn did not consistently produce the highest yields in the trials shown in Figure 2. This was not due to poor stands or frost damage, but was the result of growing conditions later in the season, and was more common when yields levels were lower. It’s difficult to untangle what happened in each of these, but in a few cases the early-planted crop experienced cool temperatures in May that might have lowered yield potential. The growing season was relatively dry in some of these sites as well, and small differences in rainfall timing could have favored the crop that was planted a little later. We added an additional planting date in mid-March in the very dry spring of 2012, and lost about half of the stand to frost during the second week of April.

Planting depth
Recent developments in automated depth and down-pressure controls on planters have brought new attention to the issues of planting depth and seed placement. While research done over a few sites often identifies a “best” depth, such results don’t very well predict what the best depth will be in a given field the next time. We can guess the best planting depth about as well as we can guess the weather, although the depth decision is easier in some soils than in others. Most studies include planting both too shallow and too deep, with a few depths in the middle, and results typically show, to no one’s surprise, that it is better to avoid planting too shallow or too deep.

An additional feature available on some planters is a sensor for soil moisture coupled with the ability to vary planting depth based on where in the soil there’s enough moisture to get germination started. This has potential for dry areas where soil moisture frequently is low during the planting season. But I think we need to be cautious with this in the eastern Corn Belt, where soils are heavier and where heavy rainfall after planting and before emergence is a much serious threat to stand establishment than dry soil at planting. Planting deeper means that emergence almost always takes longer, and that means more chances of having problems related to wet soils and surface compaction (crusting) as soils dry out after they get wet. In practice, I think this means that planting 3 inches deep or deeper in most Illinois soils (sandy soil is an exception), even if that’s where soil moisture is adequate, has a better chance of lowering stand counts than it does of increasing them. Most corn seed has the ability to emerge from 3 inches deep if soil conditions are good, but when soil conditions deteriorate after planting, those three inches can turn onto an obstacle course for seedlings. That can compromise stands and stand uniformity, both of which are needed for getting the highest yields.

Today’s planters do a good job of pressing soil against seeds for the sides and above, resulting in good seed-soil contact without compacting the soil above the seed. Good seed-soil contact forms a conduit by which water can move through the soil into the seed as germination begins. That effectively enlarges the soil volume from which seeds can draw water, which means that even soils with lower moisture content often have enough water to allow germination, especially in silt loam and silty clay loam soils without clods. Clods form when soil that was tilled when it was wet dries out. With less tillage and less time between tillage and planting today, soils often do not to dry out very much before planting. As a result, uneven stands due to uneven soil moisture is relatively rare in most Illinois fields. Those who can’t remember when they last saw uneven stands due to uneven soil moisture at planting—that is, times when some seeds had to wait for rain before they emerged—might have reason to question the advisability of having soil moisture determine how deep seeds are planted.

So where, between too shallow (let’s say one inch) and too deep (3 inches in most soils) should we plant? Soybeans planted in the first half of April with soil temperatures (2 inches deep measured at 7 or 8 AM) less than 50 should probably be planted 1.25 to 1.5 inches deep, and corn at least 1.5 inches deep. When planting into warmer soils later in April or in May, 1.5 inches is good for soybeans and 1.75 inches for corn. Manually changing planting depth on a 24-row planter is good exercise, but may not always be worth the time it takes. As long as we’re planting between 1.5 and 2 inches deep, it’s not clear that trying to fine-tune depth based on current and future soil conditions has much potential to improve stands.

Especially when planters move at speeds of 6 mph or faster and when the soil surface is not very smooth, some seeds end up shallower and some deeper than the nominal setting. Equipment and seed companies have looked at the effect of planting depth on stands and yields, and have in some cases managed to produce large yield differences by employing “mistake” settings. Measuring the uniformity of seeding depth by digging up seeds is difficult, but high-speed cameras can estimate depth as seeds drop and settle in place. One study done by digging up corn roots at maturity reported a standard deviation of about an eighth of an inch, which would mean that about 5 percent of seeds would be at least a quarter of an inch shallower or deeper than the average. That’s probably acceptable at normal planing depths. More weight and more uniform down-pressure have improved planting depth uniformity, and if 75 percent or more of plants emerge over a period of about 15 growing degree days (24 hours at average temperature, longer than that if it’s cool) and the rest within one more day, it’s unlikely that any yield has been lost due to non-uniformity of planting depth.

Uniformity of distance between seeds is good enough to maximize yield potential in most fields, and needs no further mention. Despite what yield contest winners say they do, there is no reason for most people to plant slower than they do now. If the monitor says enough seeds are being dropped, and either the monitor or previous experience (by seeing how stands look after emergence) say they’re spaced uniformly enough, they probably are.

Seeding rate
Most people have decreased the number of soybean seeds dropped per acre over the past decade or so, but seed quality has also improved, and so the number of plants needed to maximize yield has probably not decreased as much as the seeding rate. We know that seeding rate responses are highly variable: in a series of 25 seeding rate studies in Illinois between 2015 and 2018, we found that the stand (not seed) numbers needed to maximum dollar return to seed ranged from 50 to 200 thousand, and there was no correlation between yield and plant stand needed to produce that yield. That means that the best way to set seeding rates is to average over seeding rate trials to get a best-guess prediction.

Averaged over the 25 responses, the plant stand needed to maximize the net return to seed was about 107,000 plants. At 80% stand establishment, that would require planting 134,000 seeds per acre. While that seems like a reasonable seeding rate, the “best” seeding rate was higher than that in about half of the trials and less than that in the others. Responses were fairly flat in most of the trials, though, which says that moving around within a range of 125,000 to 145,000 seeds per acre won’t miss the mark by much. If you expect emergence to be higher than 80%, seeding rates can be decreased. If you’ve gotten good yields planting only 100,000 or 110,000 seeds in the past, feel free to do that again. Keep in mind, though, that yield responses to seeding rate may not be very visible. So while 100,000 seeds might produce a good yield of 75 bushels, using 130,000 seeds might increase that by 2 bushels, which won’t look like much but would increase profits by $12–13 per acre.

The response of corn to plant population is much more consistent that for soybeans. Figure 3 below shows the response to corn plant population over 44 trials in Illinois between 2012 and 2018. Each trial included four to six hybrids, with planted populations ranging from 18,000 to 50,000 per acre. Final stand closely matched seeding rate, so they’re used interchangeably. The average yield at the 100% (of maximum) yield level was 237 bushels per acre. We used a wide range of seeding rates in order to produce visible responses, even though we know that this range extends far outside the range that producers might consider. Yields at 48–50,000 plants were lower than those at 34–36,000. So what we chose as the high end of the range ending up “bending” the curve, which changed where it reaches a maximum. The curve fitted to yields from the populations up to and including 42,000 shows that the maximum yield was produced at 36,900 plants per acre, and the optimum population—where the last seeds added were paid for by the increase in yield—was 33,400 plants per acre.


Figure 3. Corn plant population response over 44 trials in Illinois, 2012–2018.

It’s also worth noting that, although we find best returns from plant populations in the 32,000 to 35,000 per acre, having them a few thousand higher or lower is not going to change yields or net returns by very much. Yield level doesn’t make much difference: yields in 2012 were about 50 bushels lower than in the highest-yielding years of this study, but the population response was about the same as in other years. Going up to 40,000 isn’t very likely to increase yields, but it won’t increase costs much, either, so it won’t do much harm in productive soils. Marlin Jeschke of Pioneer recently reported that harvest populations for non-irrigated entries in the NCGA Corn Yield Contest over the past five years was 36,700, so it’s clear that current hybrids don’t don’t require unusually high populations to produce high yields.

If planting is delayed in 2020
Should management of corn or soybean change if planting is delayed in 2020 like it was in 2019? We’re certainly hoping that any delays are not on the scale that we saw in 2019, but we did not see many signs last year of things we should change if planting is late in 2020. That may have been because of good weather and good yields even after the late planting. About the only thing we might want to consider if corn planting is delayed into June is to move to earlier–maturing hybrids in the northern part of Illinois. Hybrid strip trials planted in that region in early June last year showed lower yield for hybrids later than 107–108 days RM. We did not see this with late-planted soybeans there, nor for either corn or soybeans in central and southern Illinois.

Profitability & IL Corn/Soybean Acreage Shifts

by Gary Schnitkey, ILLINOIS Extension
link to farmdocdaily article

At its recent Agricultural Outlook Forum, the U.S. Department of Agriculture (USDA) released estimates of 2020 planted acres in the United States, with both corn and soybean acres increasing from 2019 levels (see Grain and Oilseed Outlook, February 21, 2020). When compared to 2018 plantings, USDA is projecting a 2020 shift to more corn acres and fewer soybean acres across the United States. Projecting this shift across the U.S. seems reasonable. However, most of those shifts likely will occur outside of the corn belt. Estimated 2020 profitability in Illinois suggests relatively even acres of corn and soybeans in Illinois.


A University of Illinois agricultural economist says corn is likely to be more profitable than soybeans this year across the state. However, as Todd Gleason reports, historical relationships do not suggest large acreage shifts in the state.

Projected Acreage Shifts in the U.S. For corn and soybeans, USDA is projecting higher acreages in 2020, partly because 2019 acres were reduced because of prevented plantings (see Figure 1). Corn acres are expected to increase 4 million acres from 90 million acres in 2019 to 94 million acres in 2020. Soybean acres are projected to increase by 9 million acres from 76 million in 2019 to 85 million in 2020. Wheat acres are projected to remain the same in 2019 and 2020 at 45 million acres.


Given the prevalence of prevented planting acres in 2019, comparing acreage shifts from 2018 to 2020 provide a better illustration of recent trade difficulties impacts on expected acreage. These trade difficulties lowered soybean prices while corn prices remained roughly the same. National Market Year Average (MYA) prices for soybeans reported by the National Agricultural Statistical Service (NASS) were $9.47 per bushel in 2016 and $9.33 per bushel in 2017, the two years immediately preceding trade difficulties. Soybean prices are not projected to average above $9.00 from 2018 through 2020: $8.66 per bushel in 2018, a projected $8.70 in 2019, and a projected $8.80 in 2020.

While soybean prices decreased, corn prices increased. MYA prices for corn were $3.36 per bushel in both 2016 and 2017. MYA price averaged $3.55 in 2018 and are projected at $3.80 in 2019 and $3.60 in 2020. These price changes caused corn returns to increase relative to soybean, leading to incentives to plant more corn acres. Between 2018 and 2020, corn acres are projected to grow 5 million from 89 million in 2018 to 94 million in 2020. Soybean acres are projected to decrease 4 million from 89 million acres in 2018 to 85 million acres in 2020.

Illinois Corn and Soybean Acres Because of prevented plantings, both corn and soybean plantings in Illinois were down in 2019 from 2018 levels. Corn plantings were 10.5 million acres in 2019, down from 11.0 million in 2018. Soybean planted were 10.0 million acres in 2019, down from 10.8 million acres in 2018.

Except for 2019, total acres in corn and soybeans in Illinois have remained about the same since 1990 at about 21.7 million acres. Prevented plant acres reduced this total in 2019 by 1.2 million acres. While total acres in corn and soybeans have remained the same, shifts in corn and soybean acres have occurred over time.

From 1998 to 2003, corn and soybean acres were relatively near one another, with corn acres exceeding soybean acres by less than 1 million acres (see Figure 2). During the 2007–2014 period, corn use in ethanol increased, resulting in higher corn prices relative to soybean prices, increasing the profitability of corn relative to soybeans, leading to more corn acres and fewer soybean acres. From 2007 to 2012, corn acres exceeded soybean acres by at least 2.0 million acres, with the largest difference of 4.9 million acres occurring in 2007. The build of ethanol capacity ended in the mid–2010s, while Chinese demand for soybeans continued to grow until 2018. Corn profitability fell relative to soybeans, and farmers switched acres from corn to soybeans. In 2018, 11.0 million corn acres were planted in Illinois, only 200,000 acres more than 10.8 million acres of soybean plantings. In 2019, corn acres were 10.5 million, 500,000 more than the 10.0 million of soybean planting. USDA has not projected state levels of corn and soybean production for 2020.


Profitability of Corn and Soybean in Illinois Historical shifts in corn and soybean acres in Illinois have been related to the relative profitability of corn and soybeans. Figure 3 shows corn returns minus soybean returns from Central Illinois farms having high-productivity farmland enrolled in Illinois Farm Business Farm Management (FBFM). Positive values indicate that corn was more profitable than soybeans. Conversely, negative values indicate that soybeans are more profitable than corn.


From 2000 to 2002, corn and soybean returns were roughly the same (see Figure 3). Corn-minus-soybean returns were $30 per acre in 2000, $13 in 2001, and -$6 in 2002. During this period, corn and soybean acres were relatively near one another.

From 2003 to 2012, corn returns exceeded soybean returns in all years, except 2009 (see Figure 3). Corn returns were over $50 higher than soybean returns in 2006, 2007, 2008, 2011, and 2012. During this period, corn acres in Illinois grew while soybean acres declined.

From 2013 to 2018, soybeans were more profitable than corn (see Figure 3). Soybean returns exceeded corn returns by more than $50 per acre in 2016, 2017, and 2018. During these years, farmers switched acres back to soybeans.

In 2019, corn was more profitable than soybeans by $34 per acre. Responses to 2019 profitability differences are somewhat clouded because of late and prevented planting. Both corn and soybean acres were down in 2019. In a late planting year, one expects soybean acres to increase relative to corn acres because soybeans traditionally have lower yield declines than corn in a late planting year. In 2019, corn acres may have declined more had not there been expectations of higher corn prices in June.

In 2020, corn is projected to be $21 per acre higher than soybeans. This difference between corn and soybean profitability is not large, suggesting that large acreage shifts will not occur. The $20 per acre projected difference in 2020 is roughly the same as realized differences from 2000 to 2002. During those years, corn acres exceeded soybean acres by only a small margin. Given 21.7 million acres of corn and soybean plantings in Illinois, having 11.0 million acres of corn and 10.7 acres of soybeans seems reasonable.

Summary At this point, corn is projected to be more profitable than soybeans in Illinois. However, historical relationships do not suggest large acreage shifts in Illinois. Corn and soybean acres in Illinois likely will be near one another. Major shifts in acres to corn from soybeans across the United States likely will come from outside the corn belt.

References U.S. Department of Agriculture. “Grains and Oilseeds Outlook.” Agricultural Outlook Forum 2020. Released February 21, 2020. https://www.usda.gov/oce/forum/2020/outlooks/Grains_and_Oilseeds.pdf

Projected Net Incomes on Illinois Grain Farms in 2019 and 2020


by Gary Schnitkey, ILLINOIS Extension

Due to lower corn and soybean yields, 2019 net farm incomes on Illinois grain farms are projected to decline more than $80,000 per farm from 2018 levels. The low yields are partially offset by higher corn and soybean prices and higher MFP payments in 2019 as compared to 2018. Incomes in 2020 are projected to be negative if yields are at trend levels and Market Facilitation Program (MFP) payments do not occur.

Historic Net Incomes on Illinois Grain Farms
Figure 1 shows average yearly net incomes on grain farms enrolled in Illinois Farm Business Farm Management (FBFM). These net incomes are averages across all grain farms in Illinois. Size, tenure relationships, and financial structures vary across these farms. Many farms are below 1,000 tillable acres, and some farms have over 8,000 acres. Over time, the size of farms has grown. In 2018, the average number of tillable acres was around 1,500 acres.


As can be seen in Figure 1, there are three distinct periods of net income. Between 1996 and 2005, net income averaged $55,000 per farm. This period was characterized by relatively low corn and soybean prices, resulting in low incomes. Income during this period reached a low of $11,000 in 1998, a year in which government programs were instituted to provide price and income support to grain farms.

From 2006 to 2013, incomes were much higher, averaging $189,000 per farm. Corn and soybean prices were higher than the other two periods due to increased use of corn in ethanol production, growing export demand for soybeans, and yield shortfalls occurring in several years. The prime example of a yield shortfall was 2012, a year of intense drought over much of the eastern and lower corn-belt. While yields were low in 2012, corn and soybean prices reach all-time highs. High prices, along with proceeds from crop insurance products, resulted in a record income of $298,000 per farm.

Prices have been lower since 2013, with corn prices generally being below $4.00 per bushel and soybean prices being below $10.00 per bushel. From 2013 to 2018, net incomes have averaged $79,000 per farm, about $110,000 less per farm than the 2006–2012 period. Incomes during the 2013–2018 period have been $24,000 higher than the 1996–2006 period, but have been much more variable. Incomes have varied from $500 per farm in 2015 up to $147,000 in 2018.

Compared to 2013 through 2017, incomes were much higher in 2018. In 2018, soybean prices fell partially due to U.S. trade disputes with China and other countries. In 2018, central Illinois farms on high-productivity farmland averaged $8.85 per bushel of soybeans, down from the $9.81 per bushel average from 2014 to 2018 (see Table 1). Two factors countered this price decline resulting in higher 2018 incomes:
  1. Yields were exceptional. While yields have been high since 2014, 2018 yields were truly outstanding. On central Illinois farms, corn yields averaged 237 bushels per acre in 2018, 16 bushels per acre higher than the 221 bushel average from 2014 to 2017. Soybean yields averaged 74 bushels per acre, 8 bushels higher than the 67 bushel average from 2014 to 2017.
  2. Market Facilitation Program (MFP) payments. In 2019, MFP payments in central Illinois averaged $122 per acre for soybeans and $1 per acre for corn. Without these payments, 2018 incomes would have been below the 2013–2017 average.


Projected 2019 Incomes
The average net income in Illinois will be below $60,000 per farm, much lower than in 2018, with possibilities for incomes approaching 2015 levels on many farms. Most of the decline in net income is associated with lower gross revenue, as opposed to a significant change in expenses. On central Illinois high-productivity farmland, gross revenue averaged $819 per acre in 2018, given that 50% of the acres were in corn and 50% were in soybeans (see Table 1). Average gross revenue is projected at $761 per acre in 2019, $58 lower than in 2018. Factors impacting revenue from 2018 to 2019 are:
  1. Lower yields. In central Illinois, corn yields are projected at 205 bushels per acre in 2019, down by 32 bushels per acre from 2018 levels. Soybeans yields are projected at 58 bushels per acre, down by 16 bushels per acre from the 74 bushel average in 2018. Lower yields are the major reason for lower incomes.
  2. Prices are projected to be higher in 2019 as compared to 2018. Projections are made with a $3.90 corn price in 2019, compared to a $3.60 price in 2018. Soybean prices are projected at $9.00 for 2019, compared to $8.85 in 2018. Higher prices partially offset lower yields, resulting in higher incomes.
  3. MFP payments are projected at $82 per acre for both corn and soybeans in 2019. MFP payments will average about $20 per acre higher in 2019 as compared to 2018 on Illinois grain farms. Without MFP payments, average income on Illinois grain farms would be negative in 2019.
The $58 per acre decline in gross revenue from 2018 results in a net income that is $87,000 lower per farm ($58 per acre times 1,500 acres) in 2019. This leads to an estimate of net income for central Illinois farms of $60,000 ($147,000 income in 2018 minus $87,000 less income). Central Illinois likely will have some of the highest yields in the state, and therefore higher incomes than other areas. In northern Illinois, for example, yields are projected at 185 bushels per acre for corn, resulting in much lower income projections for northern Illinois. As a result, average incomes on Illinois farms likely will be below $50,000 per farm when averaged across Illinois.

Projected 2020 Incomes
Current projections would place revenue lower in 2020 as compared to 2019. In central Illinois, for example, average gross revenue is projected at $695 per acre in 2020, a decrease of $66 per acre from 2019 projected levels of $761 per acre (see Table 1). These projections are based on:
  1. A return to trend yields, which are higher than 2019 yields. Projections use a 211 bushel per acre yield for corn and 63 bushels per acre for soybeans.
  2. Stable prices of $3.90 per bushel for corn and $9.00 per bushel for soybeans.
  3. No MFP payments.
  4. No commodity title payments from Agricultural Risk Coverage or Price Loss Coverage.
These values would result in a negative average net income for 2020. Many factors could result in higher incomes, with two of the more likely factors being:
  1. A return to above-average yields. From 2014 to 2018, yields averaged 225 bushels per acre for corn and 68 bushels per acre for soybeans. These higher yields would result in average gross revenue of $745 per acre, still below the $761 projection for 2019. While higher yields are quite possible, those higher yields could be associated with price declines from projected levels. The impact of potentially lower prices are not considered in the projections, and would partially offset the impacts of higher yields.
  2. A continuation of the Market Facilitation Program. Another payment of $82 per acre will bring gross revenue near 2019 levels if yields return to trend levels.
Summary
Lower yields will contribute too much lower incomes on Illinois grain farms in 2019. A continuation of low incomes is projected into 2020. Without a continuation of the MFP program in 2020, incomes on Illinois farms will be negative if prices do not increase given that trend yields occur.
Soybean prices have fallen since the trade dispute began in 2018. Currently, soybean prices are near $9.00. Note that this $9 price results with considerably lower soybean acres in 2019, and much lower yields. In the current supply and demand environment, a return to more normal acres and above-trend yields likely would push prices below $9.00 per bushel. Farmers have not felt the full impact of lower prices because MFP payments have supported income in 2018 and 2019. If prices do not increase or yields are not exceptional, farms may have negative incomes without MFP payments in 2020.

Acknowledgements
The author would like to acknowledge that data used in this study comes from the local Farm Business Farm Management (FBFM) Associations across the State of Illinois. Without their cooperation, information as comprehensive and accurate as this would not be available for educational purposes. FBFM, which consists of 5,500 plus farmers and 60 professional field staff, is a not-for-profit organization available to all farm operators in Illinois. FBFM field staff provide on-farm counsel along with recordkeeping, farm financial management, business entity planning and income tax management. For more information, please contact the State FBFM Office located at the University of Illinois Department of Agricultural and Consumer Economics at 217–333–5511 or visit the FBFM website at www.fbfm.org.

RIVIAN | All Electric Pickup Truck

Rivian Automotive LLC expects to build an electric plug-in pickup truck and SUV starting in 2020. Todd Gleason talks with Michael McHale about the startup company and its plans to produce the vehicles in Normal, Illinois. They also take up the impact electric vehicles are having on the automotive industry and potentially ethanol made from corn.

Backyard Maple Syrup Production Workshop Feb 2

register by January 30th

The fourth annual backyard maple syrup production workshop will be held on Saturday, February 2, 2019 from 10am–3pm at the Dixon Springs Agricultural Center, located at 354 State Highway 145 N, Simpson, IL 62985. This program is free and open to the public.

We are offering an expanded program this year! From 10-noon come learn the basics and see firsthand the entire process of backyard maple syrup production. Following a free lunch at noon, we will have maple syrup experts on hand to discuss scaling up production and advanced techniques and demonstrating equipment from 1pm to 3pm.

During the morning session, the University of Illinois Extension will provide some activities for kids, including taste testing of real maple syrup!

Program Schedule
* 10:00am to Noon - Maple syrup basics, kids activities, field tour
* Noon to 1:00pm - Lunch (provided)
* 1:00pm to 3:00 pm - Advanced techniques and equipment demo

You can choose to come to the morning session, the afternoon session or both! Register by January 30th.

For more information: Chris Evans cwevans@illinois.edu , 618–695–3383

University of Illinois College of Agricultural, Consumer and Environmental Sciences United States Department of Agriculture. Local Extension Councils Cooperating provides equal opportunities in programming and employment.

If you need a reasonable accommodation to participate in this program, contact Dixon Springs Ag Center at 618–695–2441.

2019 Illinois Crop Budgets are Dismal

The numbers look bad for Illinois grain farmers next year.

That’s the only conclusion Gary Schnitkey can draw when he puts the costs up against the incomes for corn and soybeans in 2019. Schnitkey, an ag economist at the Univesity of Illinois, says fuel and fertilizer costs are expected to go up. Prices aren’t and that’s the dismal part says Schnitkey, “Probably the one thing that has changed relative to recent years is that corn is expected to be more profitable than soybeans. Again, that is largely due to our use of $3.60 for a 2019 corn price and $8.50 for soybeans. This switches the profitability around. That’s driven by trade concerns, particularly with China and what that has done to commodity prices.”

Here’s an example of the bottom line for next year’s budget. A northern Illinois farmer might expect to have $174 to split between the farmer and the landowner for corn and $143 for soybeans. This return is considerably below the cost of cash rent and roughly, says Schnitkey, near the 2005 returns.

2019 Crop Budgets Suggest Dismal Corn and Soybean Returns

Even with cost-cutting and savings measures, University of Illinois Agricultural Economist Gary Schnitkey says, for the moment, it seems unlikely farmers will have positive returns on rented farmland in 2019. Todd Gleason has more…

2018 Cash Rents were up $5/acre in Illinois


University of Illinois Agricultural Economist Gary Schnitkey discusses the surprise $5 an acre cash rent increase seen in the state wide 2018 survey numbers and how farm economics look going into the 2019 growing season.

by USDA NASS
see the 2018 USDA Land Values Survey

Agricultural Land Values Highlights

The United States farm real estate value, a measurement of the value of all land and buildings on farms, averaged $3,140 per acre for 2018, up $60 per acre (1.9 percent) from 2017 values.


Regional changes in the average value of farm real estate ranged from an 8.3 percent increase in the Southern Plains region to 1.4 percent decrease in the Northern Plains region. The highest farm real estate values were in the Corn Belt region at $6,430 per acre. The Mountain region had the lowest farm real estate value at $1,140 per acre.


The United States cropland value averaged $4,130 per acre, an increase of $40 per acre from the previous year. In the Southern Plains region, the average cropland value increased 4.7 percent from the previous year, while in the Lake region, cropland values decreased by 0.6 percent.
The United States pasture value increased by $40 per acre (3.0 percent) from 2017 values. The Southern Plains region had the highest increase from 2017 at 5.6 percent. The Pacific region remained unchanged at $1,650 per acre.


Cropland value: The value of land used to grow field crops, vegetables, or land harvested for hay. Land that switches back and forth between cropland and pasture should be valued as cropland. Hay land, idle cropland, and cropland enrolled in government conservation programs should be valued as cropland.

Projected Cutting Dates for Black Cutworm in Corn


Farmers should be on the lookout for black cutworm in their corn fields.

The earliest projected cutting dates were late last week in Montgomery County. University of Illinois Extension Entomologist Nick Seiter says fields especially at risk to having plants cut by the black cut worm include those with later planted corn and those sown into grassy weeds or a late terminated cover crop. Seiter explains, “What you are going to want to do is to scout your field. Look for plants lying on the ground that appear to have been cut with scissors. This is different looking than damage from a bird digging up the plant looking for the seed. These corn plants will be cut off. When you start finding that, scrape around in the residue looking for the larvae. The black cut worm larva is dark colored, with a greasy appearance. It is not slimy, but it looks like it has been coated with Crisco. If you find the worms and about three percent of the plants have been cut throughout the field it is the time to initiate a treatment.”

Seiter says there are several pyrethroid insecticides that can be successfully used as a rescue treatment. He offers these black cutworm management pain on the University of Illinois the Bulletin website.
  • Infestations are more likely in later planted corn, as delayed planting means larger cutworm larvae are present at earlier stages of corn development.
  • Black cutworm moths prefer to lay their eggs on grasses, not bare ground. Therefore, fields with grassy weeds present at or shortly before planting are more likely to experience damaging populations. Similarly, monitor fields closely if a grass cover crop (e.g., cereal rye) is terminated while corn is susceptible to cutworm damage (emergence to ~V5).
  • The economic threshold for black cutworm is 3% of plants cut with black cutworms still present in the field. Look for plants that look like they have been cut roughly with scissors close to the base; plants with intact roots were most likely dug up by birds and do not represent cutworm damage. Remember, larvae do their feeding at night and hide in residue or just below the soil surface during the day, so you will have to do a little bit of digging near the base of the plant to find them.
  • Several Bt corn trait packages offer suppression of black cutworm, but these might be less effective under heavy infestations or against later stage larvae. Most pyrethroid insecticides labeled for use in corn will do an excellent job of controlling larvae as a rescue treatment; just remember that they only pay off when an economic threshold has been reached.
Kelly Estes at the Illinois Natural History Survey coordinates an insect trapping network throughout the state and those results, including the black cut worm cutting dates, are posted online at The Bulletin website - that’s bulletin.ipm.illinois.edu and on twitter using the handles @ILPestBulletin or @ILPestSurvey.

Soil-borne Plant Disease Trials @ Illinois

Over the next few years, companies will release new and updated ways to use seed treatments to control soil-borne diseases in corn and soybeans. Researchers at the University of Illinois are looking to assess how well each of these might work.

One of the first steps in the scientific process is to lay out the trials. In this case that means intentionally inoculating the area with a disease says University of Illinois Extension Plant Pathologist Nathan Kleczewski, “We are putting in some different soybean and corn trials today looking at different seed treatments for controlling seed-borne diseases. So, we have some pythium trials, some SDS trials, and some rhizoctonia trials. We’re getting those in the ground.”

Kleczewski is testing how well both old and new seed-treatment products work. He’s wants to see how efficacious they are at controlling corn and soybean plant diseases, “We are also trying some existing products utilizing different mechanisms of application to see if they might be more or less effective than current ways we are applying them.”

The extension based research done on the Univeristy of Illinois farms will guide future recommendations the Land Grant makes as it relates to the use of seed-treatments.

Cash Rents and the 2019 Growing Season

Professional farm managers in the state of Illinois have completed a cash rent survey. Todd Gleason reports it is a fairly go indicator of where cash rents in the state can be expected to go. He talked with University of Illinois Agricultural Economist Gary Schnitkey about the results.

Renovating Downtown Milford, Illinois


The old lumber yard building in Milford, Illinois has been renovated. It now serves the county as an events venue and is part of one farmer’s hope for rural America. - photo courtesy Colleen Caldwell, owner Town and Country Events

A local farmer has taken it upon herself to renovate some of the buildings in downtown Milford, Illinois. Farm Broadcaster Todd Gleason has this interview with Colleen Caldwell of Town & Country Events. Gleason met her while emceeing a crop insurance meeting in late January.

Corn, Soybeans, and Wheat Acres in Illinois


Between 1996 and 2017, the sum of acres planted to corn, soybeans, and wheat have varied within a tight band for the state of Illinois. It has ranged from 22.0 million to 22.7 million acres for the three crops. Over this period acreage planted to wheat has been small and declining. It has decreased from 1.7 million in 1996 to just half-a-million in 2017. University of Illinois Agricultural Economist Gary Schnitkey says most of the acreage switches in the state have been between corn and soybeans.


These are the historical facts for Illinois. In 1998, corn and soybean acres were each at 10.6 million. With some yearly variations, corn acres then increased and soybean acres generally decreased from 1998 to 2012. In 2012, 12.8 million acres of corn were planted and 9.0 million acres of soybeans. Since then, corn acres have decreased and soybean acres have increased. Corn acres declined from 12.8 million in 2012 to 11.2 million in 2016. Soybean increased from 9.0 million to that same 11.2 million over the same period.
Weather-related decision permits trucks hauling ag commodities to exceed gross vehicle weight limits, speed crop transportation
YORKVILLE (Nov. 5, 2017) — Gov. Bruce Rauner today declared a statewide harvest emergency to assist farmers and grain handlers who are grappling with the fallout of rain-related delays.

“Illinois is home to 72,000 farms on 26.7 million acres. We are among the top three corn producers in the nation,” Rauner said while visiting Stewart Farms in Yorkville Sunday afternoon. “Moving corn and other crops in a timely and efficient manner affects the bottom line of hard-working farmers. This declaration is an appropriate response to an urgent need.”

Under a new law Rauner signed Aug. 11, the declaration permits drivers of trucks carrying agricultural commodities over state highways to obtain a free permit to exceed gross vehicle weight limits by 10 percent. Further, local authorities may waive the permit requirement at their discretion. The emergency declaration is in effect for 45 days beginning today, Nov. 5.

The Illinois Department of Transportation already is mobilizing the permitting process and notifying law enforcement agencies throughout the state. More information is available at https://truckpermits.dot.illinois.gov/.

“I would like to thank the governor for making this declaration today,” said Richard Guebert Jr., president of the Illinois Farm Bureau. “This harvest season emergency declaration will improve the transportation of our crops.”

According to data from the U.S. Department of Agriculture, the Illinois corn harvest at the end of October was 17 percentage points behind the prior year and 11 percentage points behind the five-year average. The corn harvests in the Northwest, Northeast and East regions are especially hard hit. Harvesters of a variety of crops made up ground toward the end of October, but early delays still are causing backups in the transportation chain.

Jeff Adkisson, executive vice president of the Grain and Feed Association of Illinois, also praised the governor’s action, noting that a bumper crop combined with the harvest delays to compound the situation.

“In years when harvest is better than anticipated, crops like corn and soybeans may need to be stored in piles outside of the traditional concrete or steel bins or tanks,” he said. “This declaration will allow grain elevators to transport commodities out of their facilities quicker, thus making room for grain stored on the ground to be moved to more suitable storage structures.”

Illinois Department of Agriculture Director Raymond Poe said the action will encourage the farming community.

“Illinois farmers work tirelessly year-round, even more so around harvest,” he said. “The Department of Agriculture would like to thank Gov. Rauner for making this declaration and for his support of Illinois farmers.”

And state legislators also welcomed the harvest emergency declaration.
State Rep. Toni McCombie, R-Savanna, co-sponsored HB 2580, which amended the state vehicle code to allow for exceeding trucks’ gross weight limits when a governor declares a harvest emergency.

“Mother Nature has presented Illinois farmers with a rainy spring and fall, making this year’s harvest challenging,” she said. “The State of Illinois was proactive when we foresaw an emergency this year.”

“Farmers form the backbone of our state’s economy,” said state Sen. Neil Anderson, a Republican from Andalusia who sponsored the legislation in the Senate. “Declaring a harvest emergency will reduce red tape and allow those farmers who are still in the field to focus on getting their crops in before winter really takes hold.

“The sooner farmers can get their commodities to market, the more stable the market will be for the consumer.”

State Rep. Dan Swanson, R-Alpha, a member of the House Agriculture and Conservation Committee, said the rainy planting season caused corn and beans to mature later this fall.

“As a result, many farmers are behind in getting their crops harvested,” he said. “With this declaration of a harvest emergency, we will allow farmers the ability to get more grain to the storage sites quicker.”

State by State & Regional Corn Yields

This map shows the August 2017 USDA Crop Production Report state by state corn yields. Rollover each state to reveal the yield. Darker green colors represent higher yields. The table gives more complete detail and breaks down the nation by region. Note the twelve corn belt states in the Midwest are expected to yield 8.4 bushels to the acre less this year than last. The southern states, while representing only about 1.5 billion bushels of the total expected 2017 production of 14.2 billion show a year over year increase of nearly 14 bushels to the acre.

CME Group Provides Scholarships for Agriculture

Agricultural companies are always on the hunt for good employees, but those with college educations can be hard to find. Todd Gleason reports from the Illinois State Fair that the world’s largest options and futures exchange is hoping to inspire a few more kids to further their education.

Adjusting Nitrogen for this Corn Crop

read blog post

Despite the wet weather many think may be causing nitrogen fertilizer to get away from corn plants, it is still far too early to make that decision.

While it seems likely some nitrogen fertilizer has moved out of the upper soil as a result of rainfall this year University of Illinois Agronomist Emerson Nafziger says if soils dry out, the torrential rains stop, the sun shines, and the weather gets warmer things should be all good, “The crop is going to tell us this. If by the middle of June some of the crop has really greened up nicely and some has not, then we might need to think about those that haven’t and determine if enough nitrogen is missing to cause this to take place. My suspicion is we will not see very much of that at all. If we are warm and dry and with sunshine for a week, I think the crop is going to look good in almost every field.”

My suspicion is we will not see very much of that at all. If we are warm and dry and with sunshine for a week, I think the crop is going to look good in almost every field. - Emerson Nafziger

One indication the topsoil hasn’t been stripped clean of nitrogen is the good recovery of green leaf color. Nafziger says, as soils dry out, root systems start to expand and the color will change. He explains the corn crop at this point looks like it does not because of lack of N, but due to cool temperatures and abundant rainfall. While it is premature to revise nitrogen management based on what has happened so far, Nafziger cautions it cannot be ruled out, “I would be very reluctant now to make a decision that we need to go put more nitrogen on, especially if we’ve already put the full amount on. If we still need to side-dress and we add 10, or 15, or 20 pounds I don’t have a problem with that. But I think it is premature to decide so much of the nitrogen is gone that we put out there that we need to go back and plan to put more on at this point.”

The good news is there is still time to make such decisions. The corn crop takes up barely one pound of N per acre for every inch of growth it makes up to about knee-high.

Nitrogen deficiency develops over time, and Nafziger says it is almost always more related to current soil moisture than to the amount nitrogen in the soil. So, if fields aren’t extra wet or extra dry over the next month, this season could still turn out to be much more typical than many now expect.

Trump's Propose Cut to SNAP & Food Insecurity

The White House has released a new budget proposal, and it’s not good news for the Supplemental Nutrition Assistance Plan, commonly known as food stamps or Link in Illinois. The plan calls for a $193 billion, or 25 percent, cut to the program that currently serves 42 million Americans. Craig Gundersen, professor in the Department of Agricultural and Consumer Economics at the University of Illinois, has been studying SNAP and its effects on food insecurity for years.

“SNAP is a great program. It is the key component of the social safety net against food insecurity,” Gundersen says.

Given the success of SNAP, Gundersen emphasizes that efforts to cut the size of the program will lead to dramatic increases in food insecurity.

Food insecurity and SNAP were the topics of a recent podcast and Twitter chat with Gundersen.

According to Gundersen, food insecurity is a major contributor to negative health outcomes in the United States. These range from depression and malnutrition to behavioral problems for children in school. Given this, it is not surprising that food insecurity also leads to substantially higher health care costs. “Because SNAP leads to greater food security, the program also brings down health care costs,” he says.

Overall, Gundersen says he can’t think of a more successful government program than SNAP. The research indicates that the program is associated with higher nutrient intake, reductions in poverty, and reductions in infant mortality. But it does more than that.

“One of the key advantages to SNAP is that it gives dignity to recipients,” he says. “They can purchase what they think is best for their families. Restricting that is demeaning and stigmatizing to poor people.”