Posts

Showing posts with the label USDA NASS

2018 Cash Rents were up $5/acre in Illinois


University of Illinois Agricultural Economist Gary Schnitkey discusses the surprise $5 an acre cash rent increase seen in the state wide 2018 survey numbers and how farm economics look going into the 2019 growing season.

by USDA NASS
see the 2018 USDA Land Values Survey

Agricultural Land Values Highlights

The United States farm real estate value, a measurement of the value of all land and buildings on farms, averaged $3,140 per acre for 2018, up $60 per acre (1.9 percent) from 2017 values.


Regional changes in the average value of farm real estate ranged from an 8.3 percent increase in the Southern Plains region to 1.4 percent decrease in the Northern Plains region. The highest farm real estate values were in the Corn Belt region at $6,430 per acre. The Mountain region had the lowest farm real estate value at $1,140 per acre.


The United States cropland value averaged $4,130 per acre, an increase of $40 per acre from the previous year. In the Southern Plains region, the average cropland value increased 4.7 percent from the previous year, while in the Lake region, cropland values decreased by 0.6 percent.
The United States pasture value increased by $40 per acre (3.0 percent) from 2017 values. The Southern Plains region had the highest increase from 2017 at 5.6 percent. The Pacific region remained unchanged at $1,650 per acre.


Cropland value: The value of land used to grow field crops, vegetables, or land harvested for hay. Land that switches back and forth between cropland and pasture should be valued as cropland. Hay land, idle cropland, and cropland enrolled in government conservation programs should be valued as cropland.

How USDA NASS Gathers Crop Production Report Data

USDA NASS will release the first corn and soybean Crop Production Report of the season Thursday, August 10th, 2017. Todd Gleason talks with USDA NASS State Statistician Mark Schleusener about how the information is collected and calculated.

USDA's June 30 Grain Stocks Report for Corn

USDA’s release of the Quarterly Grain Stocks report on June 30 will provide an estimate of corn stocks in storage as of June 1, 2017. Since many of the consumption categories for corn can be derived from data provided during the marketing year, this estimate provides the ability to calculate the magnitude of feed and residual use of corn during the third quarter. The calculation offers the basis for evaluating the probable feed and residual use during the entire marketing year and imparts information on the potential size of ending stocks.

While the information imparted by the June Acreage report released on the same day will likely eclipse the Quarterly Grain Stocks report, the estimated corn stocks have important implications for the current marketing year.

The supply of corn available during the first half of the 2016–17 marketing year is the base for estimating June 1 stocks. Corn stocks at the beginning of the quarter were estimated at 8616 million bushels in the March Grain Stocks report. Currently, the Census Bureau estimates for corn imports are only available through April. In the first half of the marketing year, corn imports totaled 26 million bushels. Imports for the third quarter might have been around 12 million bushels. By combining imports with the beginning stocks, total available supply for the second quarter comes in at 8628 million bushels.

An estimate of corn exports for the third quarter is based on the cumulative weekly export inspections estimate available for the entire quarter. Cumulative marketing year export inspections through May totaled approximately 1738 million bushels. During the first eight months of the marketing year, total Census Bureau corn exports were greater than cumulative export inspections by 45 million bushels. Assuming the margin is maintained through May, corn exports through three quarters of the year equaled 1783 million bushels. Since exports in the first half of the marketing year totaled 1095 million bushels, the estimate for third quarter corn exports equals 688 million bushels.

The Grain Crushing and Co-Products Production report released on June 1 estimated corn used for ethanol and co-product production during March and April of 2017 at 893 million bushels. Weekly estimates of ethanol production provided by the Energy Information Administration indicates ethanol production increased by 5.5 percent in May 2017 from the preceding year. By calculating the amount of corn used to produce ethanol from these May numbers, corn used for ethanol production in May was approximately 449 million bushels. Total use for the quarter is estimated at 1342 million bushels.

Corn used to produce other food and industrial products during the 2016–17 marketing year is projected at 1470 million bushels by the USDA. Using historical corn use data, typically around 75 percent of the final marketing year food and industrial products use occurs in the first three quarters of the marketing year. If this historical pattern holds and the USDA projection is correct, corn use for the first three quarters of the marketing year totaled 1102 million bushels. Corn use during the first half equaled 689 million bushels which set the third quarter use estimate at 413 million bushels.

The current USDA projection for feed and residual use sits at 5500 million bushels. The historical pattern of feed and residual use in corn may provide some indication of the third quarter use. For the five previous marketing years, use during the first three quarters of the marketing year ranged from 90.5 – 94.2 percent of the marketing year total with an average of 91.6 percent. Third quarter feed and residual use ranged from 15 to 21 percent of the total use over this time span. For this analysis, the 91.6 percent average during the first three quarters of the previous five marketing years is used to calculate expected feed and residual use during the third quarter. If the USDA projection is correct, feed and residual use during the first three quarters of the 2016–17 marketing year totaled 5038 million bushels. Feed and residual use equaled 3797 million bushels in the first half. Therefore, the third quarter estimate totals 1241 million bushels.

By adding the estimates for exports and domestic uses, the total use of corn during the third quarter is estimated at 3684 million bushels. The total use estimate for the third quarter places June 1 corn stocks at 4944 million bushels. At this level, June 1 stocks come in 222 million bushels larger than the estimated 2016 June 1 corn stocks.

A June 1 corn stocks estimate that supports the USDA projection of 5500 million bushels of feed and residual use during the 2016–17 marketing year is considered neutral for corn prices. An estimate of corn stocks that deviates more than 100 to 150 million bushels from market expectations would provide an indication of changes in domestic feed and residual and alter expectations for ending stocks. This analysis indicates an estimate near 4944 million bushels should not change expectations that feed and residual use is on track to meet the marketing year projection.

Crop Progress Reports & End of Season Yields

read blog post

Last week USDA released its first national corn condition rating of the season. The crop, as you’ll hear, wasn’t in great shape. While it doesn’t mean much at this time of year, there is a relationship between the first crop condition rating and the end of the season yield.

The weekly Crop Progress report is mostly the work of Extension and FSA employees, at the least the data collection part. They report local crop conditions to state USDA offices, mostly on Monday morning, who in-turn tally those numbers and pass them along to Washington, D.C. for compilation and release on Monday afternoon. Work at the University of Illinois shows a strong relationship between the end-of-season crop condition ratings and crop yield, however, agricultural economist Scott Irwin says that doesn’t hold so well for the rest of the season, “but, of course, what you really want to know is how soon do they become really predictive of final yields. Our analysis says they become pretty useful about mid-July for corn and not until about mid-August in soybeans”.

The first corn rating of the season, released just after Memorial Day, wasn’t good. the crop had been cold and wet. It showed up, or in this case didn’t show up, in the good and excellent categories USDA NASS uses. Those are the two grades the U of I economist say correlate. The math works like this; the first corn condition rating was 65% good or excellent, minus 8 points for the average drop to the end of the season rating, which brings you to 57% and then you plug that into the relationship the U of I presented in the article says Irwin, “and you end up with 164.3, basically on that set of calculations. It is an intriguing and pretty low number. Clearly that is not where the market is at and it is just one model, one exercise. Certainly, it is something to keep your eye on”.

“and you end up with 164.3”

If you do, in about mid-July you can use the math in the farmdocDaily article to forward calculate the national average yield for corn; mid-August for soybean.

USDA Reports | September 12, 2016

USDA Crop Production and WASDE reports released 11am central Monday September 12, 2016. Visit our USDA Reports page for full details.


Corn production is forecast at 15.1 billion bushels, up 11 percent from last year but down less than one percent from the August forecast. Based on conditions as of September 1, yields are expected to average 174.4 bushels per acre, down 0.7 bushel from the August forecast but up 6 bushels from 2015. If realized, this will be the highest yield and production on record for the United States. Area harvested for grain is forecast at 86.6 million acres, unchanged from the August forecast, but up 7 percent from 2015.

Soybean production is forecast at a record 4.20 billion bushels, up 3 percent from August and up 7 percent from last year. Based on September 1 conditions, yields are expected to average a record 50.6 bushels per acre, up 1.7 bushels from last month and up 2.6 bushels from last year. Area for harvest in the United States is forecast at a record 83.0 million acres, unchanged from August but up 1 percent from 2015.

Selected States Yield

CORN
Aug    Sep     State
200.0  200.0  Illinois
187.0  185.0  Indiana
198.0  196.0  Iowa
184.0  184.0  Minnesota
187.0  184.0  Nebraska
145.0  151.0  Kansas
163.0  162.0  Ohio
147.0  142.0  South Dakota
135.0  135.0  North Dakota

SOYBEAN
Aug    Sep     State
 57.0   61.0    Illinois
 55.0   58.0    Indiana
 57.0   58.0    Iowa
 47.0   49.0    Minnesota
 59.0   59.0    Nebraska
 40.0   44.0    Kansas
 52.0   53.0    Ohio
 42.0   43.0    South Dakota
 33.0   35.0    North Dakota

July 5 | USDA NASS Weekly Crop Progress Report


Ag Census Mapping Tool Makes Data Visual

Every five years the United States Department of Agriculture takes a census. USDA NASS collects all kinds of data about farm production in the U.S.A. The agency has developed a tool to map this data. It is a way to visualize agricultural production, income, wealth distribution, management type, and the demographics of farmers. These three maps show the primary growing regions for corn, soybean, and wheat. The darkest green areas represent acres where the cropland is at least 45 percent sown to the crop listed. The corn belt is easy to see, and not that much of a surprise. However, the primary soybean growing regions of the nation are bit more diverse than you might expect and seem to follow the Mississippi Valley watershed from New Orleans to St. Louis, along the Ohio River Valley and the mighty Missouri River.

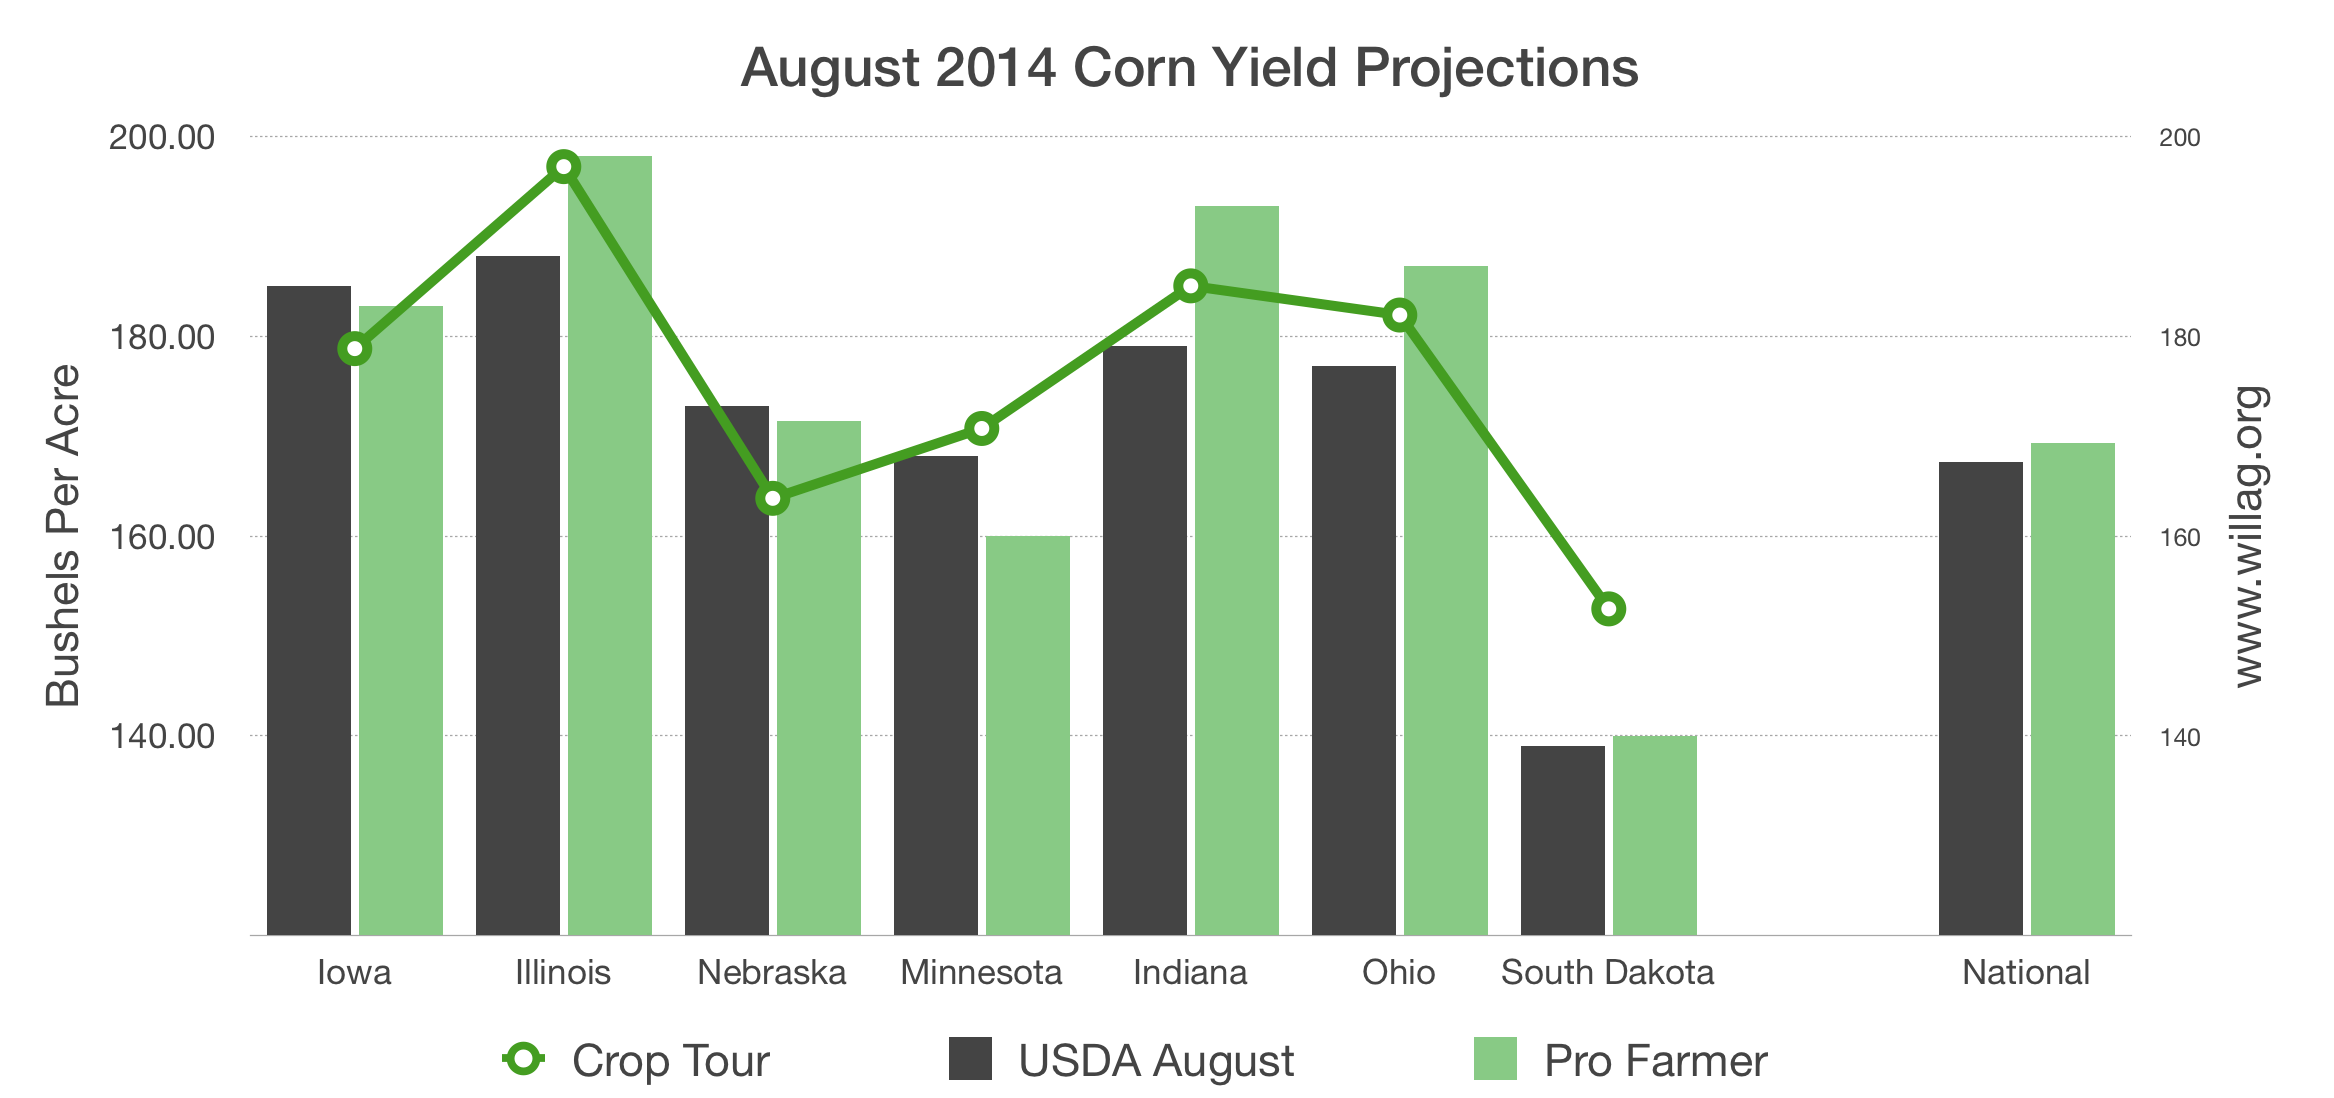
August Corn Estimates

Pro Farmer Midwest Crop Tour results are plotted here against the United States Department of Agriculture National Agricultural Statistic Service corn yield projections and the Pro Farmer Newsletter estimates. USDA NASS estimates are as of August 1, 2014 and the Pro Farmer crop tour yields were taken the week beginning Monday August 18. The Pro Farmer estimates were made August 22, 2014.
The final Pro Farmer Midwest Crop Tour estimates tallied corn and soybean yields across seven Midwestern states stretching through the primary corn growing counties in the United States. The tour is watched closely by those in the grain and oilseed trade. However, it should be noted USDA gathers much more objective and survey based information about the size of U.S. crops. 
--
2014 Midwest Pro Farmer Tour Results
Corn        Soybean      State
182.11     1342.42       Ohio
185.03     1220.79       Indiana
196.96     1299.17       Illinois
178.75     1173.59       Iowa
163.77     1103.26       Nebraska
170.76     1031.54       Minnesota
152.71     1057.80       South Dakota

Ag Economist Darrel Good Discusses August USDA Reports