Posts

Showing posts with the label United States

Corn Acreage in 2019

read farmdocDaily article

The number of acres of corn planted this spring will be a key factor in determining where the price of corn goes. University of Illinois Agricultural Economist Todd Hubbs took up the issue in this week’s farmdocDaily article.


He starts with a historical graph. It shows the principal crop acres in the United States and how those have changed since 1997. Both corn and soybean acreage have increased. Combined they’re up about 10 percent over the past two decades.


Illinois’ Todd Hubbs uses that history to help put the number or corn and soybeans acres into perspective, “When we look at the harvest month corn to soybean futures price ratio this year it has been about 2.37. There is a definite signal in this graph from about 2006 to 2018 that if you are above 2.4 in that ratio, there will be less corn acreage. If you are below 2.3 there will be more corn acreage. We are today sitting right in between those. We’ve seen problems with fieldwork in large parts of the corn belt. We’ve seen fertilizer and other input costs go up on corn. So, the idea that we are going to see a massive increase in corn acreage could happen, but under the current price structure we might not see the kind of corn acreage we think we are going to see.”


Hubbs says he used the 2019–20 futures prices to forward calculate a seasons average cash price for new crop corn. His calculation points to $3.81 per bushel. He then figured a stocks-to-use ratio that would fit that number, “I think an 11% stocks to use ratio in 2019–2020 would give us $3.81. If consumption is constant at 14.8 billion bushels from this marketing year to the next, that would put corn acreage around 91.7 million at a national trend line yield of 174.6 bushels to the acre.”

Finally, Hubbs says there isn’t a lot of weather premium priced into new crop corn futures. He also says there isn’t much of premium built in for a possible trade deal with China. Hubbs thinks that may be just as bullish for corn as it is for soybeans. Right now he thinks the 2.37 soybean/corn ratio feels high if the expectation is for a substantial increase in corn acreage.

Soybean Crush Continues Strength


by Todd Hubbs, Agricultural Economist - University of Illinois
read farmdocDaily article

Soybean crush levels picked up substantially over the last few months due to strong crush margins. Driven by production issues in Argentina, the increase in crush margin recently is attributed to rapid growth in soybean meal prices. For the 2017–08 marketing year, the USDA currently projects the domestic crush at 1.97 billion bushels, up 3.6 percent from last marketing year. Soybean meal use needs to build on recent progress to meet or exceed the current crush projection.


Soybean crush during the first half of the marketing year from September 2017 through February 2018 equaled 1010.6 million bushels, 3.5 percent greater than the total of the previous year. The USDA’s current projection indicates a 3.6 percent increase for the year and implies that the crush during the last half of the year will be 3.7 percent larger than the crush during the previous marketing year. The Census Bureau estimated the March 2018 crush level at 182.2 million bushels, 13 percent larger than the crush during March 2017. The March estimate implies that the crush during the last five months of the year must total 776.8 million bushels, 1.7 percent higher than the crush of a year ago, to reach the USDA projection of 1.97 billion bushels.

The pace of domestic crush accelerated in February and March on a substantial uptick in crush margin. The strengthening of the crush margin coincided with changing expectations regarding Argentinian soybean production. Current forecasts of Argentine production reflect the poor growing season and sit at 1.47 billion bushels for the 2018 crop year, down 654 million bushels from last year’s production. The potential for an additional 80 million bushel decline in production is a distinct possibility. Soybean crush projections for Argentina fell 1.95 million tons to 45.4 million tons and continued issues associated with soybean crushing in the region may lower this number over the next few months.


The growth in soybean meal prices associated with potential shortfalls saw crush margins in Decatur move from an average of $1.63 during September through February 7 to the current level of $2.63. Soybean meal prices in Decatur expanded from $327 per ton in early February to an average of $390 per ton over the last month. Soybean oil prices continue to show weakness with soy oil stocks growing to 2.44 billion pounds in March, up 0.8 percent from last year. Lower projections in the April WASDE report for biodiesel use of soybean oil and the growth in production increased marketing year ending stock projections. Soybean oil prices declined from 31.6 cents per pound in early February to an average of 29.5 cents per pound over the last month in Decatur. The continuation of crush strength in 2018 is dependent on solid soybean meal markets.

The April WASDE report increased domestic consumption of soybean meal by 250 thousand tons and expanded exports by 100 thousand tons. Total use is forecast at 47.05 million tons in April, up 4.5 percent from last year.

Domestically, large livestock supply indicates continued consumption of soybean meal throughout the spring and summer as beef, pork, and broiler production look to expand over last year’s levels on recent positive feeder and packer margins. Red meat and poultry production came in 2 percent higher during the first quarter of 2018. USDA projections set second quarter production increases at 4.4 percent. Despite the recent rise in soybean meal price, a continuation of strong domestic consumption appears feasible for 2018.


While domestic consumption of soybean meal gives added weight to continued strong crush margins, soybean meal export markets need to provide support as well. Through the first half of the soybean meal marketing year (October 2017 – March 2018), soybean meal exports increased 3.2 percent over last year, to 6.92 million short tons. The USDA’s current projection indicates a 7.8 percent increase for the year and implies that the exports during the last half of the year will be 14 percent larger than second half exports during the previous marketing year. Census Bureau estimated the March 2018 export level at 1.414 million short tons, 3 percent lower than during March 2017. Soybean meal exports during the last six months of the year must total 5.577 million tons to reach USDA projections.

While soybean exports continue to disappoint, soybean crush levels maintain a pace to set record levels of use associated with crush this marketing year. Domestic use of soybean meal appears set to maintain support for strong crush margins. The progression of soybean meal exports through the remainder of the spring and summer will provide insight into the potential for crush levels as we move into next marketing year and merit monitoring.

Discussion and graphs associated with this article available here.

Yield Implications of Delayed Corn Planting

read farmdocDaily article

The late spring has many worried. Others are confident farmers can plant a corn crop in 5 working days. University of Illinois agricultural economists have gone through the USDA data to see if this is true and what impact a late planting season might have on corn yields.

The grand prairie of Illinois is still lying dormant. Its soils are just beginning to reach that magical 50-degree mark. That’s when the corn planters begin to roll. It’s a late start to the season this year, and despite the increased size of the machinery University of Illinois Agricultural Economist Scott Irwin says it’ll still take about as much time to plant the corn crop this season as it did nearly 30 years ago, “If we are operating at our maximum capacity, it takes about fourteen days and when we say days we mean field days not calendar days, to get the job done”.

The reason is simple. There are fewer farmers using bigger machines. So, it is pretty likely it will take a while to get the corn crop in the ground says Irwin, and that has some serious implications, “Our optimum window clearly closes May 1st based on the agronomic trials we have access to and by May 10th we are definitely into the late planting time frame and it is hard to see, unless we get extraordinarily lucky with a planting window opening up, that we are not going to have above average late planted acres. Certainly in Illinois, and I am 100 percent confident of that as you go north where they are still melting the snow.”

ILLINOIS analysis suggests the number of late planted corn acres could 5 to 10% more than usual. If so, the impact on the nation wide corn yield could be between a bushel and quarter to two-and-half bushels to the acre lost.

Export Outlook for Soybeans

read farmdocDaily article

Recent data on the soybean export pace indicates stronger weekly sales. This offers hope for meeting the USDA marketing year export projection. The size of the 2018 crop in South America and the competitiveness of U.S. export prices, says University of Illinois Agricultural Economist Todd Hubbs, remain essential to determining U.S. export possibilities for the remainder of the marketing year.


ILLINOIS Ag Economist Todd Hubbs discusses the potential for U.S. soybean exports to meet USDA’s stated marketing year goal with Todd Gleason.

Secretary Perdue Comments on Trade Disputes

U.S. Crop Acreage Still Moving to Soybean

read farmdocDaily article


Todd Gleason reports on the move away from wheat and towards soybeans.

Corn is king in the United States. Soybean has been on a swift move upward. And wheat acreage has been on the decline for about 40 years. About half-way through those 4 decades two important things happened. Congress passed the 1996 farm bill - often called Freedom to Farm because it eliminated the last vestiges of supply controls for program crops and Monsanto introduced Round-Up Ready soybeans, that was 1995. The latter made it a whole lot easier to raise beans and the former, says University of Illinois Agricultural Economist Gary Schnitkey, let farmers react to the market.


From 1996 to 2012 U.S. farmers increased soybean acreage by 20 percent, corn acreage was up a bit more, but not much, and wheat acreage plummeted 36 percent. Schnitkey says much of the change can be explained by just looking at the relative profitability of the crops. Corn and soybeans are more profitable than wheat. Most would likely say the reason wheat acreage has declined in the U.S. is because of the ethanol build-out. It is, but it’s also not says Schnitkey, "You can attribute that to a number of factors. Probably the bigger one is that corn has increased its yields at a pace relatively faster than wheat. This has caused the relative profitability of corn to be higher than wheat and corn has taken over the feed grain market.
This has caused the relative profitability of corn to be higher than wheat and corn has taken over the feed grain market.
Wheat is/was the primary feed grain for much of the world. In the United States corn is fed to livestock and used to make ethanol. It is best managed when rotated with other crops, the most profitable of which is soybean.

This past year U.S. farmers planted about 90 million acres of corn and 90 million acres of soybeans. It is a new trend, says the University of Illinois ag economist, driven by continued strong export growth for soybean. The United States is projected to export over 50 percent of the soybean crop this marketing year.

Soybean acreage has substantially gained on corn acreage since 2012. While last year the acreage planted was equal, U.S. farmers actually harvested about 6 million more of the soybean acres than they did of corn. So, by harvested acreage soybeans are the number one crop in the United States and it’s not that first time that has happened. The soybean was king in 2015 as well.

How Many U.S. Soybean Acres Needed in 2018


Listen to Todd Gleason’s full interview with U of I’s Todd Hubbs

read farmdocDaily post

Farmers in the United States have been planting more and more acres to soybeans. There is a simple reason behind this increase. Soybeans have been more profitable than other crops over the last several years. The question now is how many acres will they plant next year. University of Illinois Commodity Markets Specialist Todd Hubbs has been thinking about that one and he decided to determine how many acres are needed if the stocks-to-use ratio was to stay at about 7%.

Hubbs says that number should provide a $9.50 season’s average cash price, “If we assume seven-percent stocks-to-use in 2018/2019 would give us $9.50, which would cover the cost of production in Illinois based on current projections, how many acres of soybeans national under those assumptions would we need given a trend yield? Based on a trend yield of about 46.8 bushels to the acre, and it may be higher than that in 2018, we would need about 88.4 million harvested acres to get $9.50 based on a seven-percent stocks-to-use.”

If you use USDA’s long-term trend line yield for next year, 48.4 bushels to the acre, then the harvested acreage number must drop to about 85.4 million in order to get to the $9.50 season’s average cash price. That’s 86.2 million acres planted to soybeans in the United States next spring.

Soybean Acreage in 2018 | an interview with Todd Hubbs

The market is currently sending a signal of maintaining the record high soybean acreage of 2017, but the necessity for that level of soybean acreage in 2018 could deteriorate quickly under evolving market conditions. Todd Gleason has more with University of Illinois Commodity Markets Specialist Todd Hubbs.

Pork Industry Favored by Strong Demand

Chris Hurt - This is basically a forecast for a breakeven year with all costs being covered, including labor costs and equity investors receiving a normal rate of return.

by Chris Hurt, Purdue University Extension farmdocDaily article

Hog prices are expected to increase in 2017 even with three percent more pork production. Prices will be supported by stronger demand because of a growing U.S. economy and by a robust eight percent growth in exports as projected by USDA. New packer capacity is also expected to contribute to stronger bids for hogs. Feed costs will be the lowest in a decade and total production costs are expected to be at decade lows.

The recently updated USDA inventory report found that the nation’s breeding herd was one percent larger than the herd of a year-ago. This continues a rebuilding of the herd that began in 2014 as feed prices began to move sharply lower and the industry began to recover from pig losses due to PED. The national breeding herd has increased by four percent since 2014. Notable expansions of the breeding herd in the past three years have occurred in Missouri 25 percent; Ohio 9 percent; Illinois 8 percent; and Indiana, Nebraska, and Oklahoma each up 4 percent. Farrowing intentions are up one percent for this spring and slightly below year previous levels for this coming summer.

Producers indicated to USDA that they had four percent more animals in the market herd, reflecting four percent higher farrowings last fall, a three percent increase in winter farrowings and a one percent increase in the number of pigs per litter. Given these numbers, pork supplies are expected to rise by five percent in April and May and then drop to a four percent increase for June through August. Three percent more pork can be expected for September through November of 2017 with supplies up one percent this coming winter compared to year-previous levels.

Live hog prices averaged about $46 last year with losses estimated at $11 per head. Prices are expected to be $3 to $4 higher this year. Live hog prices averaged about $50 per hundredweight in the first quarter of 2017. Prices for the second and third quarters are expected to average in the very low $50s. Prices will likely be seasonally lower in the fourth quarter and average in the mid-$40s. If so, prices would average near $49 for the year and be slightly under projected total costs of production with $1 of loss per head. This is basically a forecast for a breakeven year with all costs being covered, including labor costs and equity investors receiving a normal rate of return.

Current expectations are for feed prices to remain low in 2017, but with corn prices increasing into 2018. On a calendar year basis, U.S. corn prices received by farmers averaged $6.67 per bushel in 2012 (unweighted by marketings). Those prices fell to $3.48 per bushel in calendar 2016 and are expected to be only a few cents higher in calendar 2017. Current prospects are for corn to be $.20 to $.30 per bushel higher in calendar year 2018 due to sharp reductions in 2017 U.S. acreage.

Soybean meal averaged $478 per ton in 2014 (high-protein, Decatur, Illinois), but is expected to average only $315 per ton in 2017, the lowest calendar year price since 2010. Total feed costs per hundredweight are expected to be the lowest in a decade dating back to 2007.Total costs of production may reach 10-year lows. Estimated total costs of production reached $67 per live hundredweight in 2012 driven by high feed prices. For calendar year 2017 that may drop to $49.50, which is the lowest estimated total costs of production since 2007 and would represent 10-year lows.

What are the potential shadows for the industry this year? The first is that meat and poultry competition will be high. In addition to three percent more pork, beef production is expected to be up four percent and poultry production up two percent. There is simply a lot of competition for the consumers’ food dollars.

Secondly, the optimism for the U.S. economy that has been present in early 2017 could falter. This optimism is related to a stronger job market, low unemployment, and record seeking stock market indexes. The anticipated stimulus package of the new administration has likely been a contributor. Time will tell if Congress can agree on this legislation and move it from anticipation to reality. In addition, the FED is likely to continue a series of interest rate increases to slow growing inflation pressures.

Decade low feed cost is important reason pork producers are expected to almost cover all of their costs this year. Weather in the U.S. and in the Northern Hemisphere will be important in the final determination of yields and feed prices.

The industry needs to keep expansion of the breeding herd to near one percent each year. This one percent increase along with about one percent higher weaning rates means the industry can increase pork production about two percent a year. That is sufficient to cover a one percent growth in domestic population and about one percent annual growth needed to expand exports. Growth of the breeding herd at more than one percent could shift the industry back into losses.

Could Soybean Stocks Grow to 580 Million

Depending upon how you do the numbers there could be an enormous supply of soybeans in the U.S. by the time the fall of 2018 rolls around.

The large soybean crop in the United States hasn’t, yet, pummeled prices in Chicago. However, farmers are a bit worried the hammer blow will be struck. For now, much of the focus is on the potential size of the 2017 South American crops and the implications for demand for U.S. grown soybeans. Increasingly, however focus will shift to 2017 production prospects here in the United States.

The over-riding question is whether surpluses and low prices will persist for another year. Although University of Illinois Agricultural Economist Darrel Good says it is a bit early to speculate on supply and consumption prospects for the 2017–18 marketing year, he thinks some scenarios can be considered.

For soybeans, there is a general expectation that U.S. producers will increase acreage in the year ahead. An increase of about five million acres, to 88 million harvested acres, seems to be a common expectation right now. The extremely high soybean yields of the past three years raise some questions about a potential increase in the trend yield. However, if the 2017 U.S. average soybean yield is near our calculated linear trend value of 47.5 bushels and acreage is increased as expected, the 2017 crop would total 4.18 billion bushels, 181 million bushels less than the 2016 harvest. If soybean consumption during the 2017–18 marketing year remained at the elevated level of 4.108 billion bushels projected for the current year, stocks would grow by about 100 million bushels.

So, at the end of the 2017–18 marketing year there could be 580 million bushels of soybeans left in the supply category as ending stocks. The upshot writes Good in his Weekly Outlook is that with a trend yield of 47.5 bushels and a constant level of consumption, any increase of more than 2.85 million acres next spring would result in some further growth in year ending stocks.

Quote Summary - On the other hand, a five million acre increase in soybean area along with a constant level of consumption means that an average yield of less than 46.3 bushels would result in some increase in marketing year ending stocks.

There are obviously multiple potential acreage, yield, consumption, and ending stocks scenarios for the 2017–18 U.S. soybean marketing year. The most likely scenarios tend to favor a modest to large increase in marketing year ending stocks of soybeans. However, the soybean market is apparently not convinced that stocks will continue to grow next year, with the January 2018 futures price only $0.06 lower than the January 2017 price.

The soybean market, concludes Good, then appears to be reflecting some production risk. He thinks this perceived risk may stem from current drought conditions in the southeastern United States and/or uncertainty about potential impacts if a La Niña episode unfolds in South America.

Waiting for a Shift in U.S. Corn Acres

Farmers in the United States are about to harvest one of their best corn crops ever and prices are low. They may need to hang on to the crop for while if they want a better offer, and that could take a shift to soybeans next spring.


The United States Department of Agriculture judges this year’s corn crop to be a record breaker. If it all comes in as predicted in USDA’s September reports there will be none bigger, and the market believes it so far. The price of corn has dropped about a dollar a bushel since earlier in the summer. This price isn’t likely to change much thinks Darrel Good until some new information comes along in one of the USDA reports, and that might not be until next spring.
As long as we have that kind of carryover prospects, the market sees no reason to push prices higher to reduce consumption. - Darrel Good
The big response he’ll be looking for is in U.S. acreage next spring, says Good. The agricultural economist suggests the price of corn now, when compared to the price of soybeans, should result in some acreage shift from corn to soybeans next years. This could result in some relief on the supply side of the corn market.

This shift, if it comes, would be from farmers responding to market signals. Right now the price of soybeans compared to corn suggest farmers in the United States should seriously consider changing up next year’s crop mix, planting more soybeans. As for marketing this year’s corn crop, well, Darrel Good says it’s a waiting game for corn, and may very well be directly related to the acreage response.
There is some carry in the market. It is not huge. Prices remain fairly low. You’d say storage is a better option for corn, but you’ll have to store it at least through the first of the year, maybe into the spring of the year, before you could anticipate much of a rebound in spot prices. - Darrel Good
Darrel Good writes about the commodity markets each Monday. The articles are posted to the FarmDocDaily website.

Tillage Practices Vary Across the United States

USDA ERS, Washington, D.C. -


No-till and strip-till are two of many tillage methods farmers use to plant crops. In a no-till system, farmers plant directly into the undisturbed residue of the previous crop without tillage, except for nutrient injection; in a strip-till system, only a narrow strip is tilled where row crops are planted. These tillage practices contribute to improving soil health, and reduce net greenhouse gas emissions. During 2010-11, about 23 percent of land in corn, cotton, soybeans, and wheat was on a farm where no-till/strip-till was used on every acre (full adopters). Another 33 percent of acreage in these crops was located on farms where a mix of no-till, strip-till, and other tillage practices were used on only some acres (partial adopters). In the Prairie Gateway, Northern Great Plains, and Heartland regions—which account for 72 percent of corn, soybean, wheat, and cotton acreage—more than half of these crop acres were on farms that used no-till/strip-till to some extent. Partial adopters have the equipment and expertise, at least for some crops, to use no-till/strip-till; these farmers may be well positioned to expand these practices to a larger share of cropland acreage. This chart is from the ERS report, Conservation-Practice Adoption Rates Vary Widely by Crop and Region, December 2015. 

Limited Pork Expansion

The nation’s hog farmers have done a nice of job of not over reacting to last year’s record profits. They’ve limited their expansion plans and consequently should see a good bottomline again for this year, and maybe next.

For all of 2015, pork supplies are expected to be seven percent higher than in 2014. That year the price of pork averaged $76 mostly because the PED virus wreaked havoc on the industry. This years supplies have been farm more stable and supplies for 2016 should only be about one percent higher than in 2015. Hog prices are expected to average about $51 on a live weight basis for this year. Current projections for 2016 are for a similar average price and it means hog farmers will make money says Purdue Extension Agricultural Economist Chris Hurt.

After the record profits of 2014, there has been concern that the industry would over-expand. At this point that concern has not developed with supply and demand anticipated to be in balance for the coming 12 months. This also serves as a warning to the industry to make sure that further expansion plans remain moderate.

There seem to be growing threats in the future for the meats sector. Those include, says Chris Hurt, the continued expansion of total meat supplies into 2016 and 2017 with a rapid ramp up of poultry and increased beef production.

The large drop in finished cattle prices in recent weeks suggest that retail beef prices could begin to drop this fall and provide added competition for pork. In the longer run, beef supplies will continue to expand for multiple years. Potential weakness of meat and poultry exports is also a concern with slowing world economic growth and a strong U.S. dollar.

A strong dollar makes it more difficult to sell U.S. products overseas as they become higher priced. Speaking of price, feed prices will remain low for the next 9 months due to strong yields for 2014 and 2015 crops and weakened exports. Animal product producers will want to take advantage of harvest price lows this fall states Hurt. However, he thinks longer-term, managers need to remain aware that low feed prices are not guaranteed if weather should turn more adverse in some important growing areas.

More Red Meat Available Per Person this Year

The supply of meat in the United States is on the upswing this year. It had fallen off by about twenty pounds per person between 2007 and 2014, but now it’s making a come back says Purdue Extension Agricultural Economist Chris Hurt.

Quote Summary - USDA estimates are that per capita meat availability could surge by nearly nine pounds this year. Chicken and turkey lead the way with over five pounds of increase and pork adds an impressive increase of near four pounds per person. This means that the meat industry in one year has restored about 45 percent of the lost meat availability from 2007 to 2014.

This calculation does not include any reduced availability due to the Avian Influenza outbreak. It is likely to reduce total poultry (chicken and turkey) meat production in 2015.

Cost of Diesel & the Farm

The price of diesel has dropped and this should be helpful to U.S. farmers.


U.S. farmers struggling to find ways to cut cost will find the price of diesel fuel somewhat comforting. It is one of their larger input costs for the production of a row crops like corn or soybeans. This year that fuel cost will be sharply lower says University of Illinois Ag Economist Gary Schnitkey.
Quote Summary - Since 2011 on through 2014 diesel fuel prices have average about $3.50 per gallon. Today’s cost is about a 36% decline. It is a significant decline in the cost of diesel fuel from the last four years.
Here’s how that costs translates directly to the farm. Last year fuel cost Illinois farmers, on average, $24 per acre of corn production. A 36% drop puts that estimated cost this year at $15 per acre. It’s a nine dollar savings, but certainly not enough to really ease the coming income woes of the American corn farmer comments Schnitkey.
Quote Summary - The total cost to raise an acre of corn is about $600. So, the fuel savings is a relatively small portion of the total cost of producing corn, and for that matter soybeans in the state.
Schnitkey thinks producers should certainly consider taking advantage of the diesel fuel prices today. The other two items of note related to energy costs concern drying corn in the fall and nitrogen fertilizer. The ag economist thinks drying costs should be much lower this fall. As for the cost of nitrogen fertilizer - and this would be for next year - well he says…
Quote Summary - Patients, relative to nitrogen fertilizer and buying it, might be a good thing. Because maybe someday that will come down.
The cost of nitrogen fertilizer this year is actually higher than it was last year. Its primary creation cost is for natural gas.

How Many Corn Acres in 2015


If corn farmers want a break even price for their crop next year, they’ll need to plant fewer acres of it. Todd Gleason has more on how one ag economist has forward figured the number of corn acres needed in 2015 to push cash prices back above four dollars a bushels.

August Corn Estimates

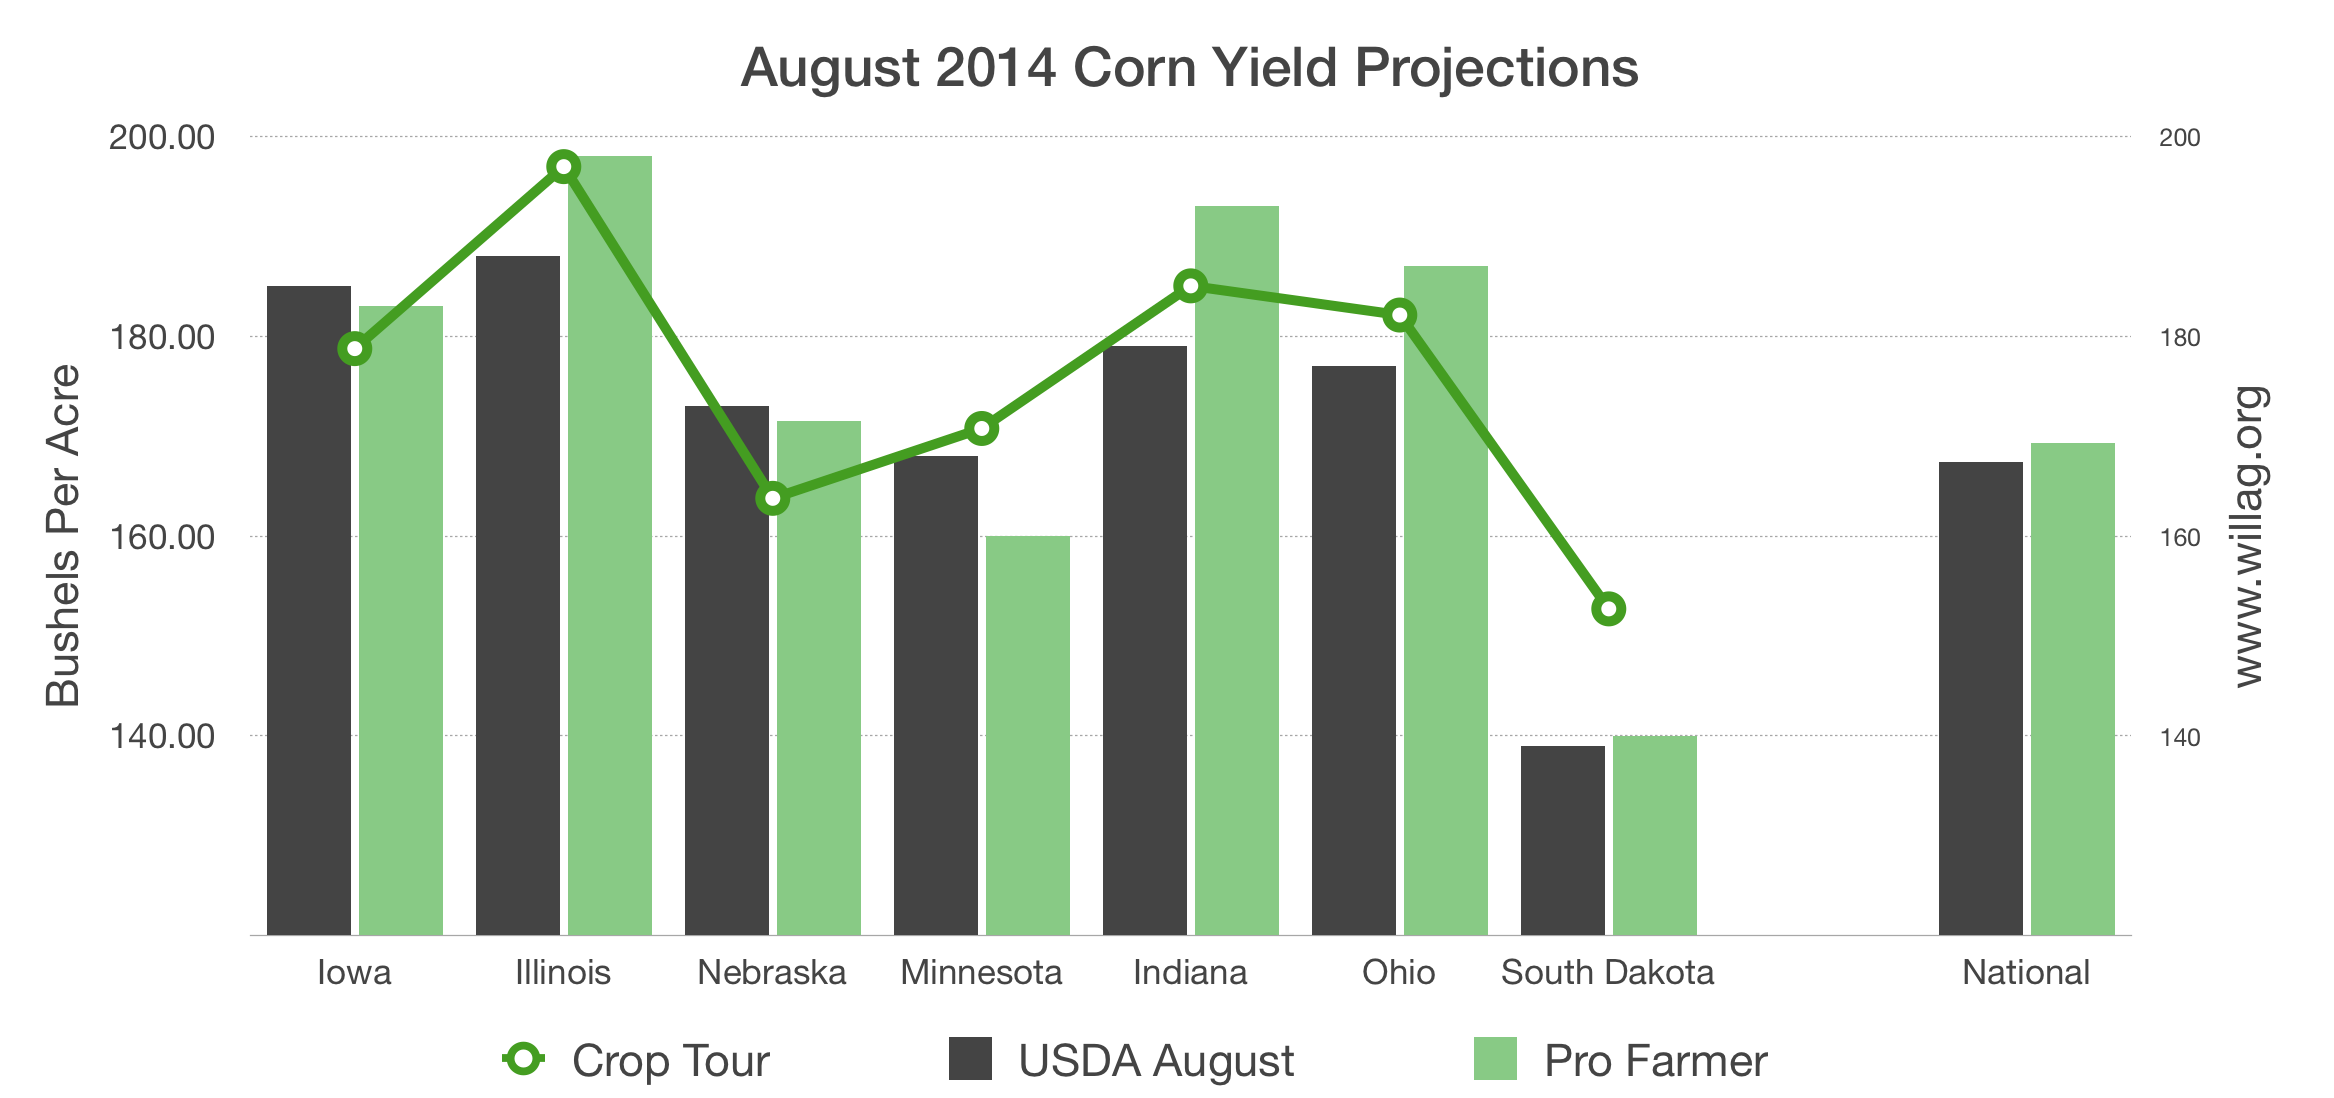
Pro Farmer Midwest Crop Tour results are plotted here against the United States Department of Agriculture National Agricultural Statistic Service corn yield projections and the Pro Farmer Newsletter estimates. USDA NASS estimates are as of August 1, 2014 and the Pro Farmer crop tour yields were taken the week beginning Monday August 18. The Pro Farmer estimates were made August 22, 2014.
The final Pro Farmer Midwest Crop Tour estimates tallied corn and soybean yields across seven Midwestern states stretching through the primary corn growing counties in the United States. The tour is watched closely by those in the grain and oilseed trade. However, it should be noted USDA gathers much more objective and survey based information about the size of U.S. crops. 
--
2014 Midwest Pro Farmer Tour Results
Corn        Soybean      State
182.11     1342.42       Ohio
185.03     1220.79       Indiana
196.96     1299.17       Illinois
178.75     1173.59       Iowa
163.77     1103.26       Nebraska
170.76     1031.54       Minnesota
152.71     1057.80       South Dakota