Recent data on the soybean export pace indicates stronger weekly sales. This offers hope for meeting the USDA marketing year export projection. The size of the 2018 crop in South America and the competitiveness of U.S. export prices, says University of Illinois Agricultural Economist Todd Hubbs, remain essential to determining U.S. export possibilities for the remainder of the marketing year.
ILLINOIS Ag Economist Todd Hubbs discusses the potential for U.S. soybean exports to meet USDA’s stated marketing year goal with Todd Gleason.
The rain fall throughout the corn belt has built a great deal of uncertainty around the size of this year’s corn crop as predicted by the United States Department of Agriculture says University of Illinois Ag Economist Darrel Good. He thinks the amount of this “uncertainty” is more than usually the case.
Crescent City, Illinois corn field July 15, 2015
USDA released projections for the 2015–16 corn marketing year July 10th. The next update is due August 12th. The new crop corn marketing-year ending stocks of corn are currently expected to be 172 million bushels smaller, and the average farm price is expected to be $0.25 higher, than projected a month earlier. Those are the numbers in question. Both are related to the size of this year’s crop, and the ILLINOIS agricultural economist has some thoughts on the “unknowns” as it relates to risk and price.
Quote Summary - In years with substantial production uncertainty, prices tend to be above the subsequent marketing year average during the growing season, offering producers the opportunity to forward price a portion of the crop. That pattern seems to be unfolding this year. New crop corn prices are currently above both the spring price for crop revenue insurance and above the upper end of the range of the USDA’s marketing year average price projection. Still, prices could trade in a relatively wide range over the next 10 weeks. Pricing decisions remain difficult for producers, particularly for those with substantial production uncertainty.
This price risk for corn, says Darrel Good can be mitigated with a combination of incremental sales at higher prices and options-strategies that provide a floor above the crop revenue price of $4.15 for December futures.
One out of every four bushels of soybeans harvested by U.S. farmers last fall, if the trend continues, will be shipped to China.
Two University of Illinois agricultural economists have measured the footprint of Chinese demand for soybeans. John Newton, along with Todd Kuethe (keeth-ee), say this one nation takes 13 bushels from every acre of soybeans produced in the United States.
Quote Summary - The Chinese are bringing in more than a billion bushels of soybeans a year from the United States. That’s more than the states of Illinois and Iowa produced combined. Their total needs from around the world amount to more than 60 million acres. Twenty-one million of those come from the U.S. This is more soybean acres than can be found in Illinois, Iowa, and Michigan. The Chinese have a very large footprint in the U.S. soybean market.
Large today, but twenty years ago China imported just 18 million bushels of soybeans from the United States, or 2 percent of U.S. soybean exports. Demand from this one nation grew from that meager amount to more than a billion bushels, 65 percent of the exports, because of double digit growth in its economy. This growth has slowed, and for some it is now a caution sign…but not for John Newton, yet.
Quote Summary - The world bank is projecting the Chinese economy is going to grow at about 6.9 to 7.4 percent through 2017. This is greater than the United States. Their economy is still growing at a significant rate. They have just plateaued some in recent years. So, you look at the growth rate in the Chinese economy as one indicator. Another indicator is crushing margins in China. Part of the reason they’ve increased their consumption of U.S. soybeans is because they’ve increased crushing capacity in mainland China. So long as their crushing margins are favorable it is still possible to bring U.S. soybeans to China and crush them.
These projections support China maintaining soybean consumption at or above current levels.
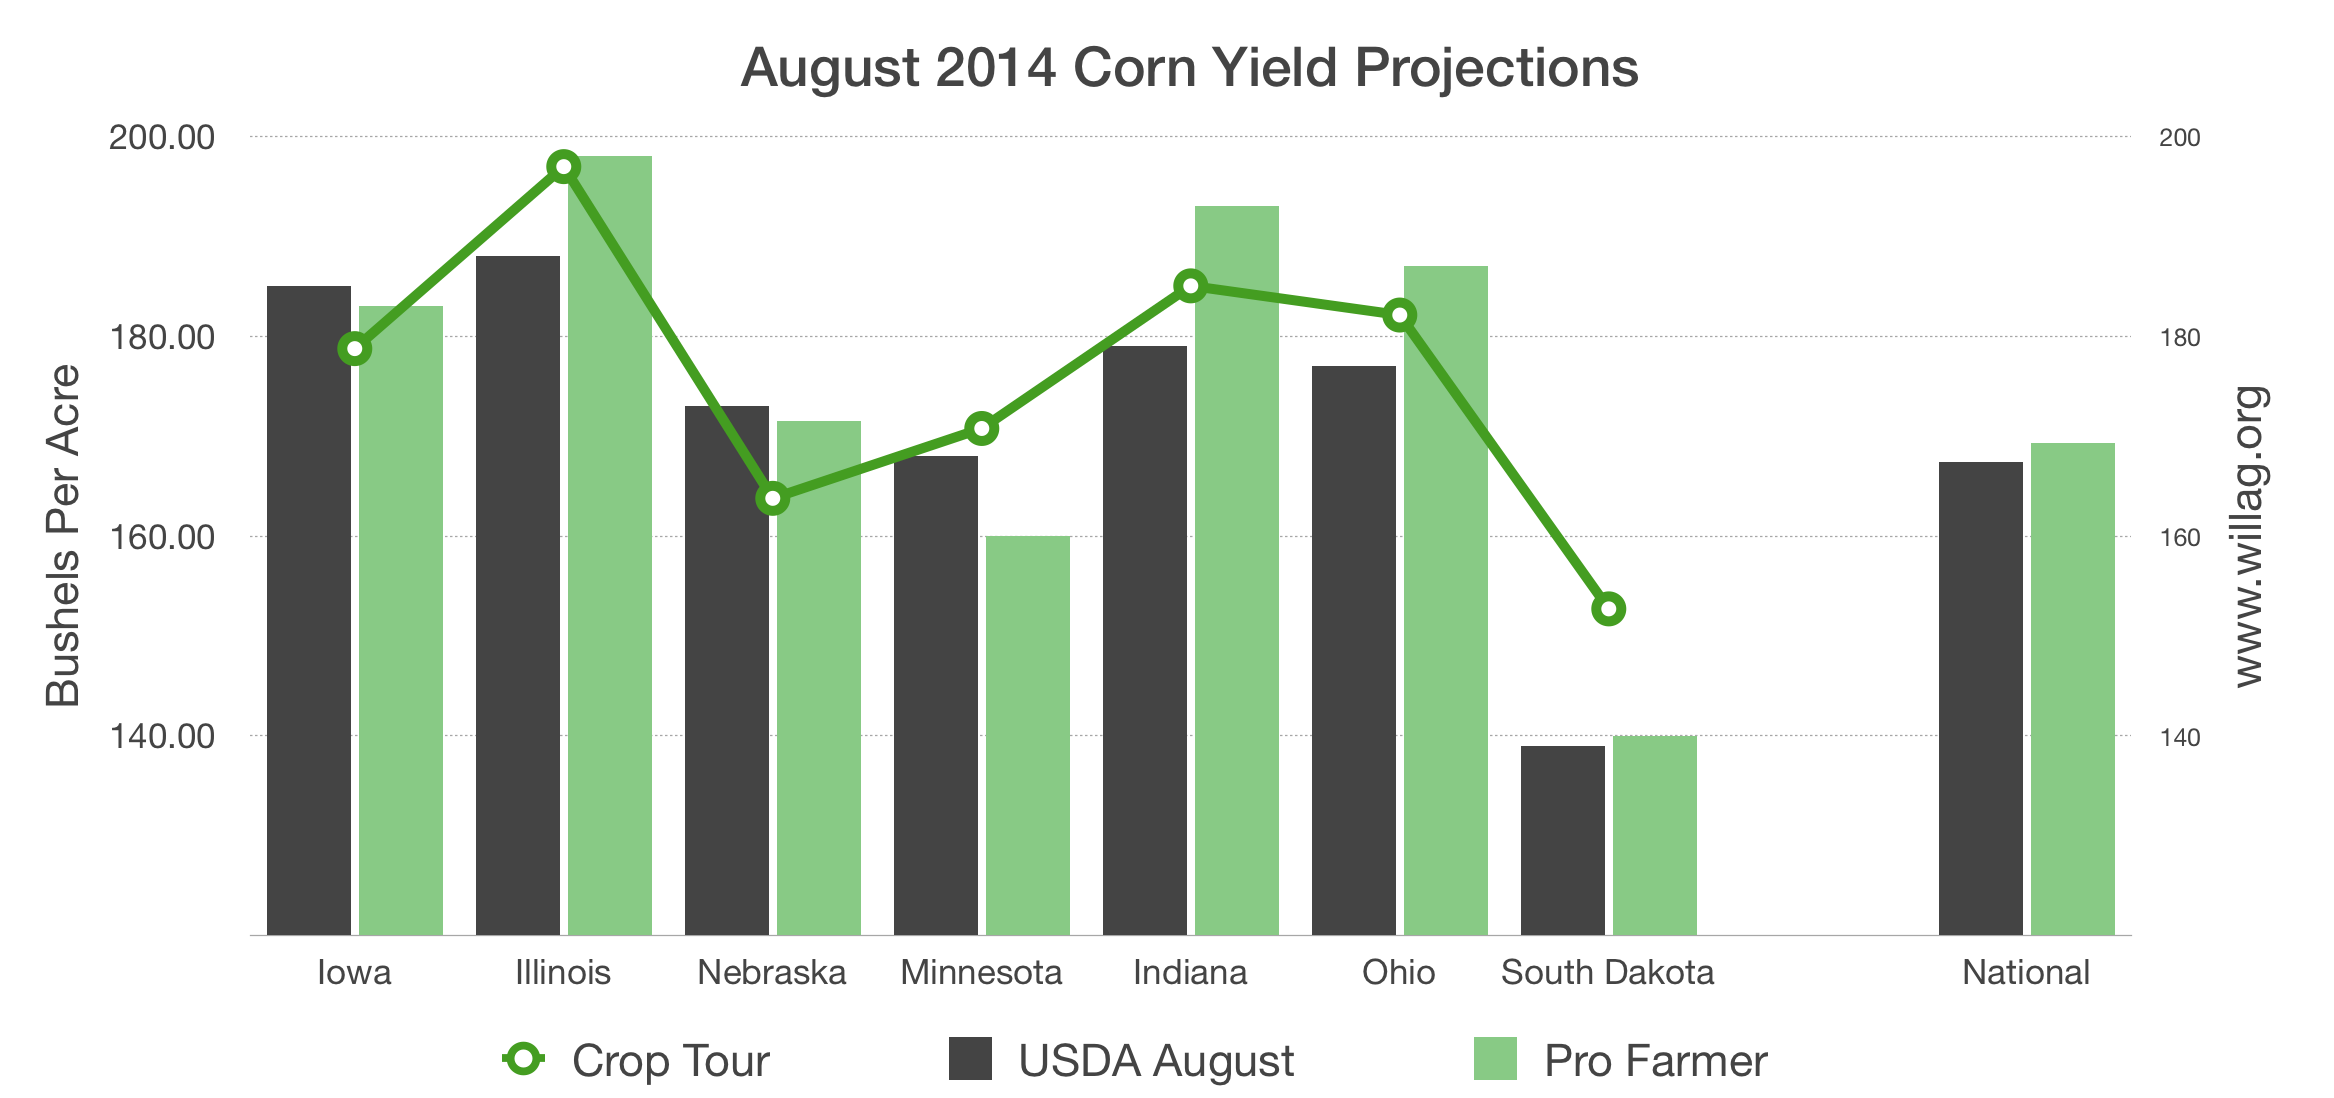
Pro Farmer Midwest Crop Tour results are plotted here against the United States Department of Agriculture National Agricultural Statistic Service corn yield projections and the Pro Farmer Newsletter estimates. USDA NASS estimates are as of August 1, 2014 and the Pro Farmer crop tour yields were taken the week beginning Monday August 18. The Pro Farmer estimates were made August 22, 2014.
The final Pro Farmer Midwest Crop Tour estimates tallied corn and soybean yields across seven Midwestern states stretching through the primary corn growing counties in the United States. The tour is watched closely by those in the grain and oilseed trade. However, it should be noted USDA gathers much more objective and survey based information about the size of U.S. crops.