Posts
Farm Assets Conference Tickets Available Now

FARM ASSETS CONFERENCE
10:15am - 5:00pm November 24, 2014
Marriott Hotel & Conference Center
201 Broadway St, Normal, IL 61761
This is a new signature event for WILLAg.The WILLAg Farm Assets Conference sponsored in part by the Farm Credit System hopes to provide farmers and landowners decisionmaking tools for their business assets. The $25 registration fee includes the noon meal. Those attending can expect to hear pricing information on agricultural commodities from WILLAg’s regular ON AIR experts, learn how the new farm bill might impact crop insurance decisions going forward, to effectively analyze and choose between the new federal ARC and PLC programs, and explore the value of farm land.
Corn & Soybean Commodity Distribution

University of Illinois
Todd E. Gleason, Farm Broadcaster
1301 W Gregory Dr, Rm75 MC710
College of Agricultural, Consumer & Environmental Sciences
Urbana, Illinois 61801
tgleason@illinois.edu
work (217) 333-9697
Urbana, Illinois 61801
tgleason@illinois.edu
work (217) 333-9697
POPULATION NOTES
* 0001 - 200 million people on the planet
* 1800 - 1 billion people on the planet
- 300 man hours to produce 100 bushels wheat from
Ag Census Mapping Tool Makes Data Visual
Every five years the United States Department of Agriculture takes a census. USDA NASS collects all kinds of data about farm production in the U.S.A. The agency has developed a tool to map this data. It is a way to visualize agricultural production, income, wealth distribution, management type, and the demographics of farmers. These three maps show the primary growing regions for corn, soybean, and wheat. The darkest green areas represent acres where the cropland is at least 45 percent sown to the crop listed. The corn belt is easy to see, and not that much of a surprise. However, the primary soybean growing regions of the nation are bit more diverse than you might expect and seem to follow the Mississippi Valley watershed from New Orleans to St. Louis, along the Ohio River Valley and the mighty Missouri River.


How Many Corn Acres in 2015
If corn farmers want a break even price for their crop next year, they’ll need to plant fewer acres of it. Todd Gleason has more on how one ag economist has forward figured the number of corn acres needed in 2015 to push cash prices back above four dollars a bushels.
Store Corn for Higher Prices Later
The price of corn isn’t great if you are a farmer trying to sell it at a profit. However, the good news may be that prices later in this year and next are likely to get better.
Tuscola, Illinois - Small Town Big Impact
Today Tuscola, Illinois will announce it will be home to a new granular urea plant. It will be built by Cronus and employee nearly 200 on completion. The plant will provide farmers within a 150 mile radius a local source for nitrogen fertilizer.
The video included here was produced by the City of Tuscola to highlight its agricultural industrial complex.
USDA Finalizes Farm Program Rules
by Jonathan Coppess, Gary Schnitkey, Nick Paulson, and Carl Zulauf
University of Illinois College of ACES and The Ohio State University
Thursday, September 25, 2014, U.S. Secretary of Agriculture Tom Vilsack announced the regulations for the Agriculture Risk Coverage (ARC) and Price Loss Coverage (PLC) programs created by the 2014 Farm Bill. Along with the regulation, Secretary Vilsack also announced the public release of the web-based decision tools that have been developed under cooperative agreements with the Farm Service Agency. This article provides more information on these items.
Background
The Agriculture Act of 2014 (the 2014 Farm Bill) revised the commodity support programs beginning with the 2014 crop year. Direct payments, counter-cyclical payments and the Average Crop Revenue Election payments were eliminated by this farm bill. In place of those support programs, three new programs were created for covered commodities or program crops. These programs are: Agriculture Risk Coverage, County Option (ARC-CO), Agriculture Risk Coverage, Individual Farm Coverage (ARC-IC), and Price Loss Coverage (PLC). The 2014 Farm Bill also provided one-time opportunities for farm owners to update the payment yields for the FSA farm and a one-time opportunity to reallocate the base acres among program crops planted on the FSA farm. Finally, the farm bill included funds for the development of web-based decision aids or tools that farmers, landowners and others could use to help sort through the program decisions required.
Discussion
The University of Illinois as the lead institution for a national coalition has worked under a cooperative agreement to develop the web-based decision tools. In addition to the web-based tools, the coalition has also created an online resource site affiliated with farmdoc and will be conducting outreach, education and training on the programs and the web-based tools. The following is an overview of the resources currently available.
(1) The Farm Bill Toolbox on farmdoc: a one-stop resource for all aspects of the farm bill program decisions, it is available here (or by entering the following web address: http://farmbilltoolbox.farmdoc.illinois.edu) provides a seven-step decision process or matrix to guide producers through the program decisions and use of the web-based tool. The Toolbox also provides one-page fact sheets and links to additional resources such as previously published articles and new articles on farm bill program issues and topics. Finally, the farmdoc team will be conducting weekly webinars explaining the programs, the web-based tool and analysis, as well as program and harvest updates. These webinars will be every Friday morning at 8:00 a.m. (CST) beginning September 26th and continuing through the end of October. Webinars will be archived and available for review. Additional webinars are also available in the archives. For registration, more information and archives please visit the Farm Bill Toolbox.
(2) The Agriculture Policy Analysis System (APAS): available here (or by entering the following web address: http://fsa.usapas.com) this web-based application provides the ability to calculate updated payment yields for the FSA farm, calculate reallocated base acres for the FSA farm and analyze, compare and understand the program choices (ARC-CO, ARC-IC and PLC/SCO). Program analysis and information is available in two forms. First, the Sample Farms button allows for a quick program comparison and analysis based on a data-generated sample farm for your state and county, both expected program payments and per-acre, crop-by-crop payments. Producers can also select the Build Your Own Farm (BYOF) option that will allow them to input their farm-specific information and run estimates of program payments. Both options also provide a "safety net" analysis using specific revenue targets and providing the probability of reaching those revenue targets under different program scenarios.
(3) Farm Service Agency: the APAS web-based tool is also available on the FSA website, along with detailed fact sheets and other related program information (available here or by entering the following web address: www.fsa.usda.gov/arc-plc).
FSA has not announced a final deadline for making the farm program decisions (payment yields, base acre reallocation and program election), but it is anticipated that the deadline will be sometime in 2015, maybe as late as March. Producers and landowners are encouraged to wait until later in the year or early next year. More information about prices and yields will be known at that time, allowing for a more informed, better decision. With many farmers already in the fields, or about to begin harvesting, there is no immediate action needed. There is time to learn more about the programs, use the web-based tools and understand the analysis before any decision will have to be made. Updates on deadlines and program decisions will be available on the Farm Bill Toolbox and through farmdoc daily.
USDA Updates Cash Rents by County
In recent weeks, two sources released cash rent information for Illinois. The U.S. Department of Agriculture released county average cash rents for 2014. The Illinois Society of Professional Farm Managers and Rural Appraisers released 2014 and expected 2015 cash rents for professionally managed farmland. Expected 2015 rents point to decreasing cash rent levels on professionally managed farmland. Whether or not other cash rents follow professionally managed cash rents down is an open question.
Average Cash Rents in Illinois
The National Agricultural Statistical Service (NASS) - an agency of the U.S. Department of Agriculture - released 2014 average rents per county on September 5, 2014. A number of counties do not have cash rents reported, likely because statistically reliable rents could not be obtained with survey responses.

figure1.jpg
Overall, 2014 average cash rents were higher in 2014 than 2013. According to NASS, the average rent in Illinois increased from $224 per acre in 2013 to $234 per acre in 2014, an increase of 5%. This continued a string of years of large increases. Since 2006, average state rents in Illinois have increased from $132 per acre in 2006 to $234 per acre in 2014, an increase over this eight year period of 77%.
Professional Cash Rents Levels
The Illinois Society of Professional Farm Managers and Rural Appraiser released results of its annual mid-year survey. This survey asked for 2014 and expected 2015 cash rents on professionally managed farmland. These rents, along with 2013 cash rents from a previous survey, are shown in Table 1. Average rent levels are shown for four classes of farmland productivity:
Excellent - expected corn yields are over 190 bushels per acre
Good - expected corn yields are between 170 and 190 bushels per acre,
Average - expected corn yields are between 150 and 170 bushels per acre, and
Fair - expected corn yields are below 150 bushels per acre.
table1.jpg
Average cash rents decreased between 2013 and 2014. For excellent quality farmland, cash rents decreased from $396 per acre to $374 per acre in 2014, a decrease of $14 per acre.

On professionally managed farmland, cash rents likely will continue to decline into 2015. For all quality classes, Society members indicated that rents would be lower in 2015. For excellent quality farmland, for example, cash rents are projected to decrease from $374 per acre in 2014 to $338 per acre in 2014, a decrease of $36 per acre (see Table 1). If the decrease occurs, cash rents would decrease by about 10%.
There is a considerable range in cash rents for similar productivity farmland within a small geographical area, with some rents above the average by $100 and other rents below the average by $100. Below average cash rents could continue to increase to "catch up" with average levels. At the same time, above average cash rents could decrease, as indicated by results from the Illinois Society. These two forces could counter each other, leading to stable or maybe even increasing average cash rent levels.

Summary
Rents on professionally managed farmland could decrease in 2015. Other above average cash rents could decrease as well. However, below average cash rents may remain stable or increase. Overall, rent decreases likely will not cover decreases in lower returns projected for 2014 and 2015.
Setting Silage Chop for Best Digestion
Corn silage can make up to as much as thirty to forty percent of a dairy cow’s diet. So, it is really important to get it right. That starts in the field. See more on some University of Illinois work on harvesting silage.
ILLINOIS' Carl Bradley on SDS & White Mold in Soybean
Some farmers like to see a little SDS because it occurs more often in high yield years for soybeans.
…anecdotal
…anecdotal
Farm Program Decision & WILLAg Outlook Panels Scheduled
Book your WILLAg event today for this fall or winter. We'll be glad to work with you to set up a WILLAg Panel of analysts to discuss the commodity markets, arrange for University of Illinois campus based agricultural specialists in economics, crops, or livestock, or simply to come speak to your group or organization. Contact Todd Gleason for complete details.
Todd E. Gleason, Farm Broadcaster
College of ACES / Univesity of Illinois Extension
tgleason@illinois.edu or (217) 333-9697
Todd E. Gleason, Farm Broadcaster
College of ACES / Univesity of Illinois Extension
tgleason@illinois.edu or (217) 333-9697
Click on an event for complete details...
August Corn Estimates
Pro Farmer Midwest Crop Tour results are plotted here against the United States Department of Agriculture National Agricultural Statistic Service corn yield projections and the Pro Farmer Newsletter estimates. USDA NASS estimates are as of August 1, 2014 and the Pro Farmer crop tour yields were taken the week beginning Monday August 18. The Pro Farmer estimates were made August 22, 2014.
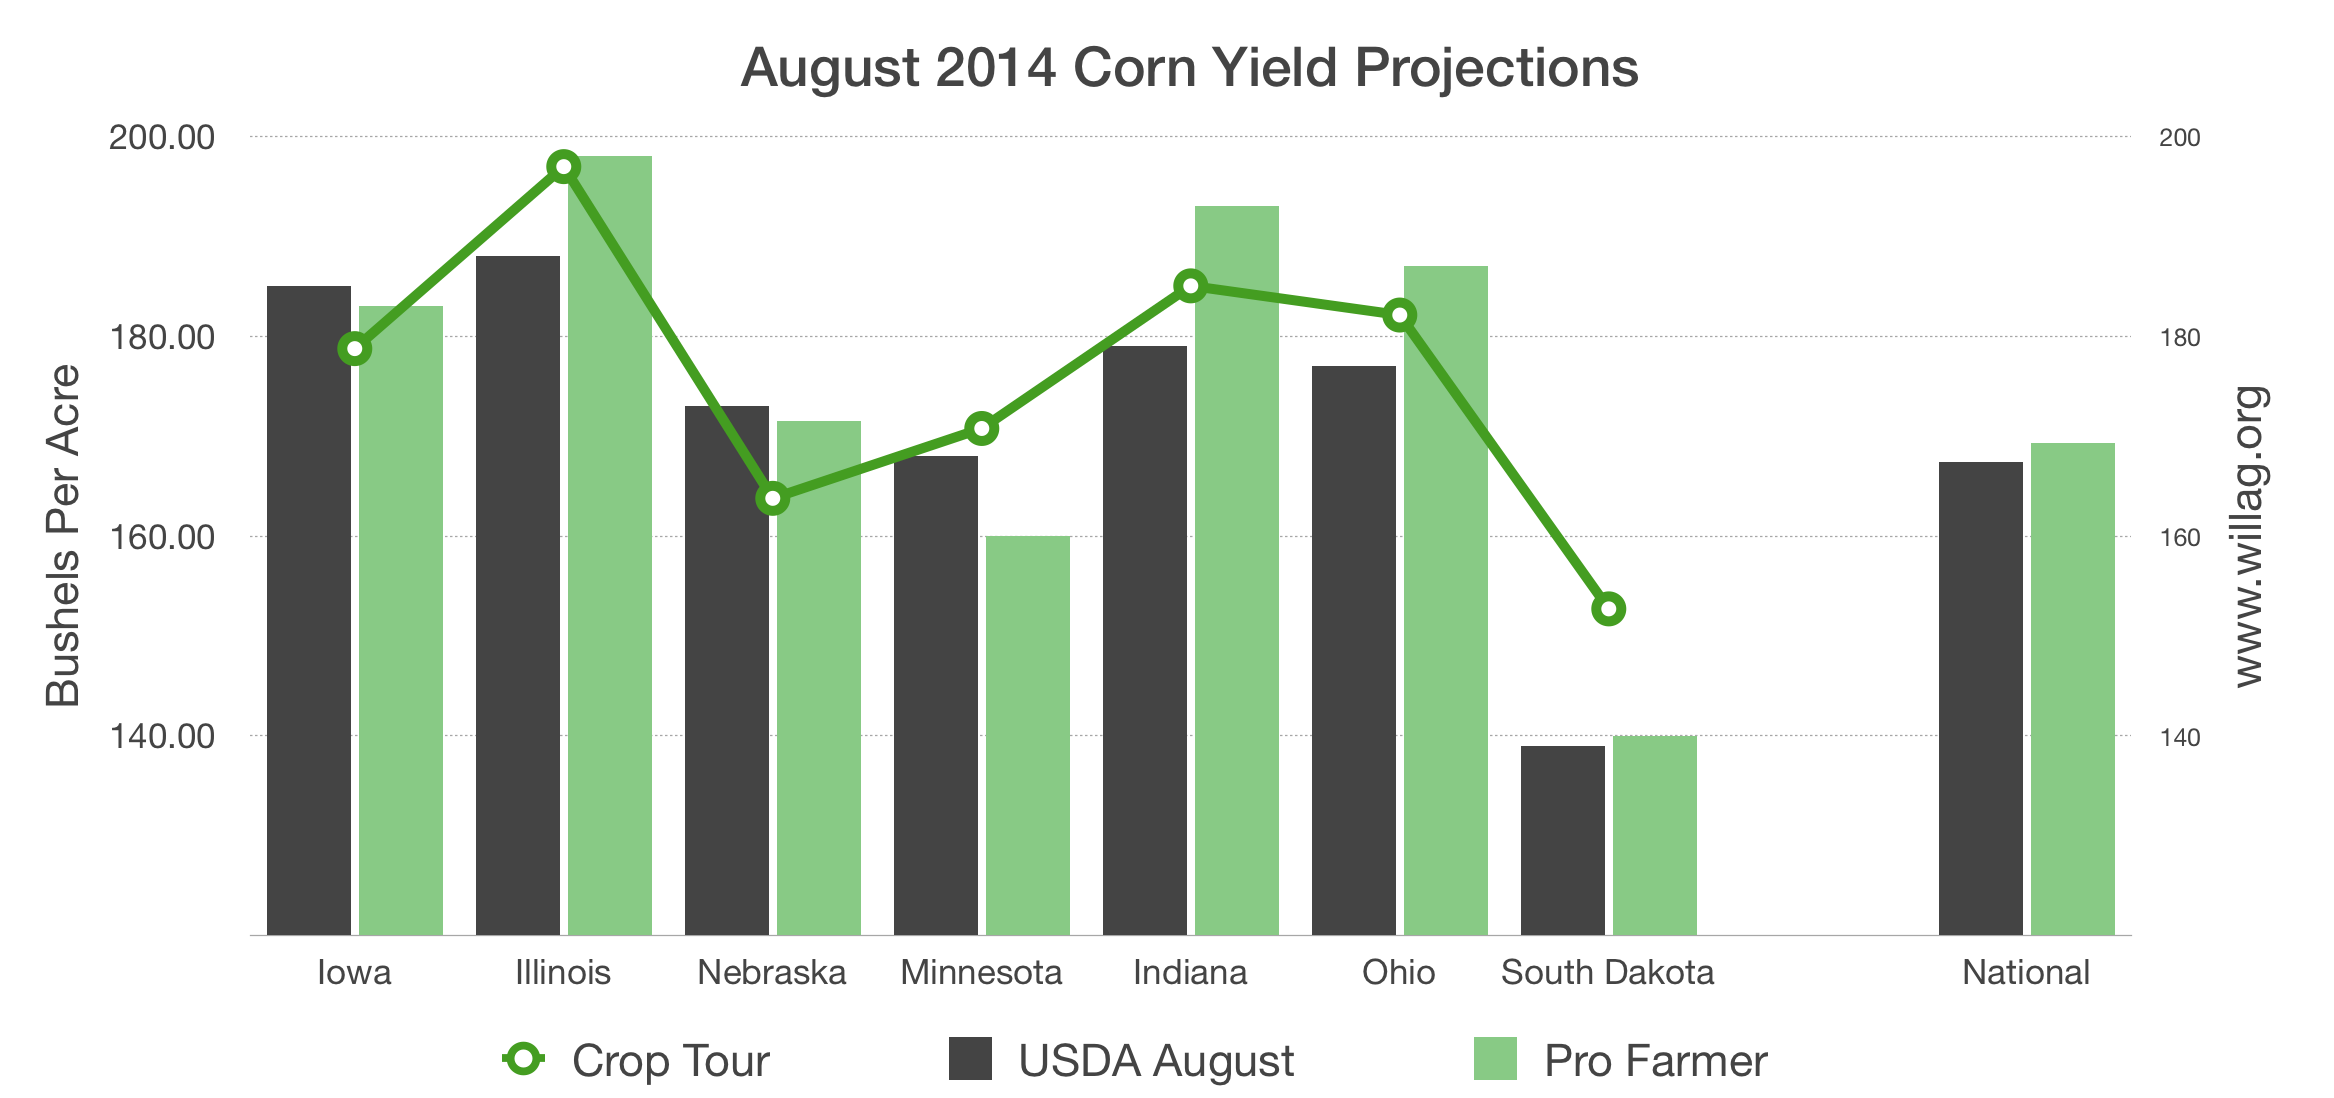
The final Pro Farmer Midwest Crop Tour estimates tallied corn and soybean yields across seven Midwestern states stretching through the primary corn growing counties in the United States. The tour is watched closely by those in the grain and oilseed trade. However, it should be noted USDA gathers much more objective and survey based information about the size of U.S. crops.
--
2014 Midwest Pro Farmer Tour Results
Corn Soybean State
182.11 1342.42 Ohio
185.03 1220.79 Indiana
196.96 1299.17 Illinois
178.75 1173.59 Iowa
163.77 1103.26 Nebraska
170.76 1031.54 Minnesota
152.71 1057.80 South Dakota
185.03 1220.79 Indiana
196.96 1299.17 Illinois
178.75 1173.59 Iowa
163.77 1103.26 Nebraska
170.76 1031.54 Minnesota
152.71 1057.80 South Dakota
ARC-CO and PLC Payment Indicator Using August WASDE U.S. Yield and Price
by Carl Zulauf, The Ohio State University & Gary Schnitkey, University of Illinois
The 2014 farm bill gives Farm Service Agency (FSA) farm owners the option to choose their crop program for the 2014 through 2018 crop years. A factor, perhaps key factor that will influence this decision is the payment by the program choices for the 2014 crop year. This article uses the just released U.S. yield and price estimates in the August 2014 World Agricultural Supply and Demand Estimates (WASDE) to calculate an indicator of potential payments by the Agriculture Revenue Coverage - county program (ARC-CO) and the Price Loss Coverage (PLC) program. The indicator estimates are for the 2014 crop year for barley, corn, oats, long grain rice, medium (and short) grain rice, sorghum, soybeans, and wheat. These are indicator estimates because they use U.S. yield not county yield or farm payment yield, as ARC-CO and PLC use, respectively. AR-CO payments, for example, will vary across counties, with some counties having no payments due to high yields and some counties having large payments due to low yields. Thus, this article is not estimating payments that an individual FSA farm owner would receive. Nevertheless, the indicator estimates using U.S. yields should help frame questions and perspectives for FSA farm owners regarding program choices.
Calculation of Estimated Program Payments
ARC-CO makes payments when county revenue for the crop year is less than 86% of the county's benchmark revenue. ARC-CO pays when actual revenue is between 76% and 86% of benchmark revenue. PLC makes payments when the U.S. crop year average price is less than the crop's reference price. The reference price is
Four Items of Interest for the Week of August 10, 2014
U of I Agronomy Day Thursday
A note for the weekend with four items from Todd Gleason ACES / Extension / WILLAg.
- Check out WILLAg's Commodity Week! I tried an experimental format and would like to know what you think. Panelist included Matt Bennett, Jacquie Voeks, & Mike Zuzolo. Shoot me an email with your thoughts - tgleason@illinois.edu.
- Watch your email for WILLAg's Crop Production & WASDE Newsletter special from Dave Dickey. The reports are due out from USDA at 11am central Tuesday.
- Thursday is Agronomy Day on the University of Illinois campus in Urbana-Champaign. Todd will emcee the day on the south farms just east of the State Farm Center (the Assembly Hall) on St. Mary's road. See details a bit further down.
- Thursday night kicks off the fall WILLAg Outlook Panel schedule in Shelbyville. The details are slow coming in on that one, but check out this webpage Monday for the finalized event.
Todd Gleason
(217) 333-9697
twitter @commodityweek
--
Thursday August 14, 2014 - 7am-Noon
Explore the latest breakthroughs in agriculture and technology with researchers and Extension specialists from the University of Illinois this Thursday at the University of Illinois south farms research plots. The day starts at 7am just to the east of the State Farm Center (Assembly Hall) on St. Mary's Road. Each tour lasts about an hour, so please come early if you plan to take all four tours. Field tours depart from the St. Mary's location, making stops atUSDA says ARC/PLC Sign Up Winter 2015
Friday the United States Department of Agriculture Farm Service Agency made a series of announcements related to the new farm programs' signup period. Farmers will make final irrevocable decisions between the ARC & PLC programs sometime after January 1, 2015.
Online tools are under development at the University of Illinois to aid producers throughout the nation. Those tools may be ready by the official end of summer (September 22, 2014), but have not yet been released.
Verifying the accuracy of data on a farm’s acreage history is an important step for producers enrolling in the upcoming Agriculture Risk Coverage (ARC) program and the Price Loss Coverage (PLC) program. Later this summer, farmers and ranchers will have an opportunity to update their crop yield information and reallocate base acres.
“We’re working hard to prepare and educate farmers on the new programs created by the 2014 Farm Bill,” added Garcia. “I encourage producers to bring their USDA notice to any scheduled appointments with the local FSA county office. This will help ensure they have the information they need with them to discuss the available program options.”
By mid-winter all producers on a farm will be required to make a one-time, unanimous and irrevocable election between price protection and county revenue protection or individual revenue protection for 2014-2018 crop years. Producers can expect to sign contracts for ARC or PLC for the 2014 and 2015 crop years in early 2015.
Covered commodities include barley, canola, large and small chickpeas, corn, crambe, flaxseed, grain sorghum, lentils, mustard seed, oats, peanuts, dry peas, rapeseed, long grain rice, medium grain rice (includes short grain rice and temperate japonica rice), safflower seed, sesame, soybeans, sunflower seed, and wheat. Upland cotton is no longer a covered commodity.
 |
| timeline posted to USDA FSA website August 1, 2014 |
Letters are in the mail this month notifying farm operators of current base acres and yields, along with 2009-2012 planting histories. The letter asks these numbers be confirmed or updated as the first part of the sign up process.
Online tools are under development at the University of Illinois to aid producers throughout the nation. Those tools may be ready by the official end of summer (September 22, 2014), but have not yet been released.
The following note was posted the USDA FSA website August 1, 2014;
WASHINGTON, Aug. 1, 2014 — U.S. Department of Agriculture (USDA) Farm Service Agency (FSA) Administrator Juan M. Garcia announced today that farmers should start receiving notices updating them on their current base acres, yields and 2009-2012 planting history. The written updates are an important part of preparing agricultural producers for the new safety net programs established by the 2014 Farm Bill.
“We’re sending these reports to make sure that farmers and ranchers have key information as they make critical decisions about programs that impact their livelihood,” said Garcia. “It’s important that producers take a few minutes to cross check the information they receive with their own farm records. If the information is correct, no further action is needed at this time. But if our letter is incomplete or incorrect, producers need to contact their local FSA county office as soon as possible.”
Verifying the accuracy of data on a farm’s acreage history is an important step for producers enrolling in the upcoming Agriculture Risk Coverage (ARC) program and the Price Loss Coverage (PLC) program. Later this summer, farmers and ranchers will have an opportunity to update their crop yield information and reallocate base acres.
“We’re working hard to prepare and educate farmers on the new programs created by the 2014 Farm Bill,” added Garcia. “I encourage producers to bring their USDA notice to any scheduled appointments with the local FSA county office. This will help ensure they have the information they need with them to discuss the available program options.”
By mid-winter all producers on a farm will be required to make a one-time, unanimous and irrevocable election between price protection and county revenue protection or individual revenue protection for 2014-2018 crop years. Producers can expect to sign contracts for ARC or PLC for the 2014 and 2015 crop years in early 2015.
Covered commodities include barley, canola, large and small chickpeas, corn, crambe, flaxseed, grain sorghum, lentils, mustard seed, oats, peanuts, dry peas, rapeseed, long grain rice, medium grain rice (includes short grain rice and temperate japonica rice), safflower seed, sesame, soybeans, sunflower seed, and wheat. Upland cotton is no longer a covered commodity.